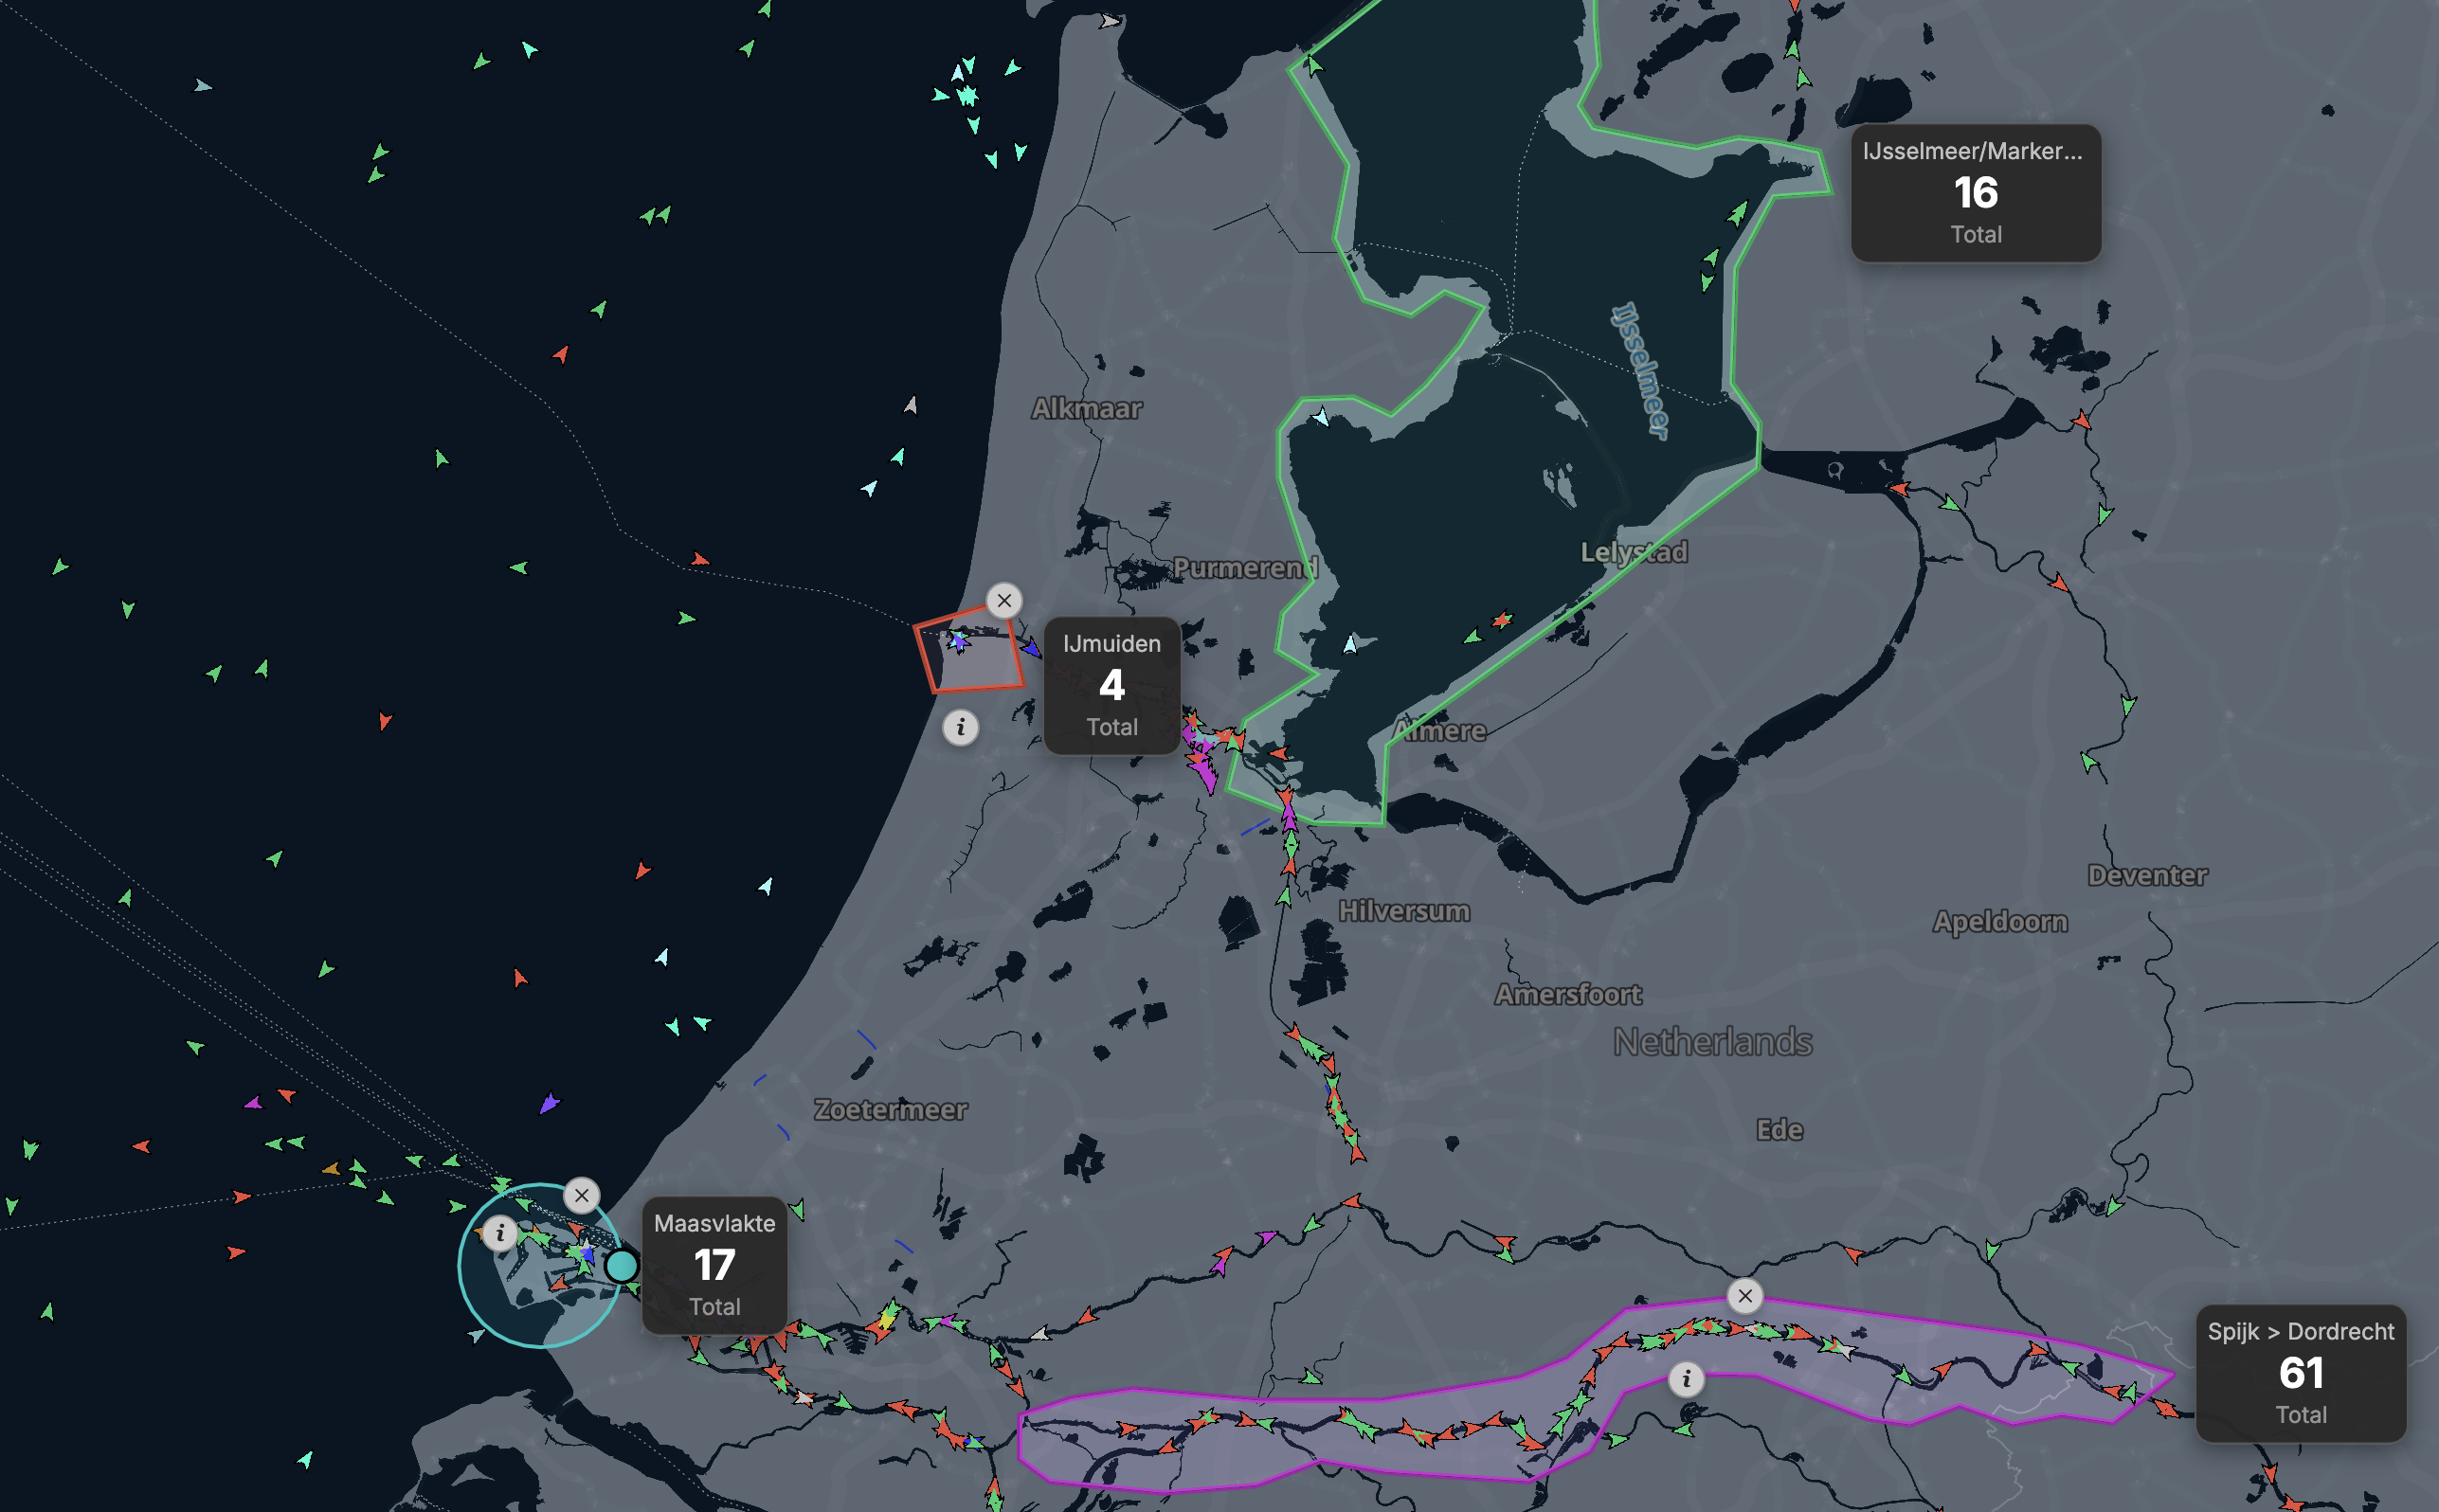
Live mode is where UAIS starts. Draw an area anywhere on the water and read what's happening inside it immediately — how busy, what's moving, which way. Free to use.
Learn more ↓Live mode is the default view — no timeline, no date picker. Draw your area, read what's inside it, and save the report.
The map fills as vessels report in — the default view, no timeline.
Any shape, anywhere — and UAIS counts what's inside it at once.
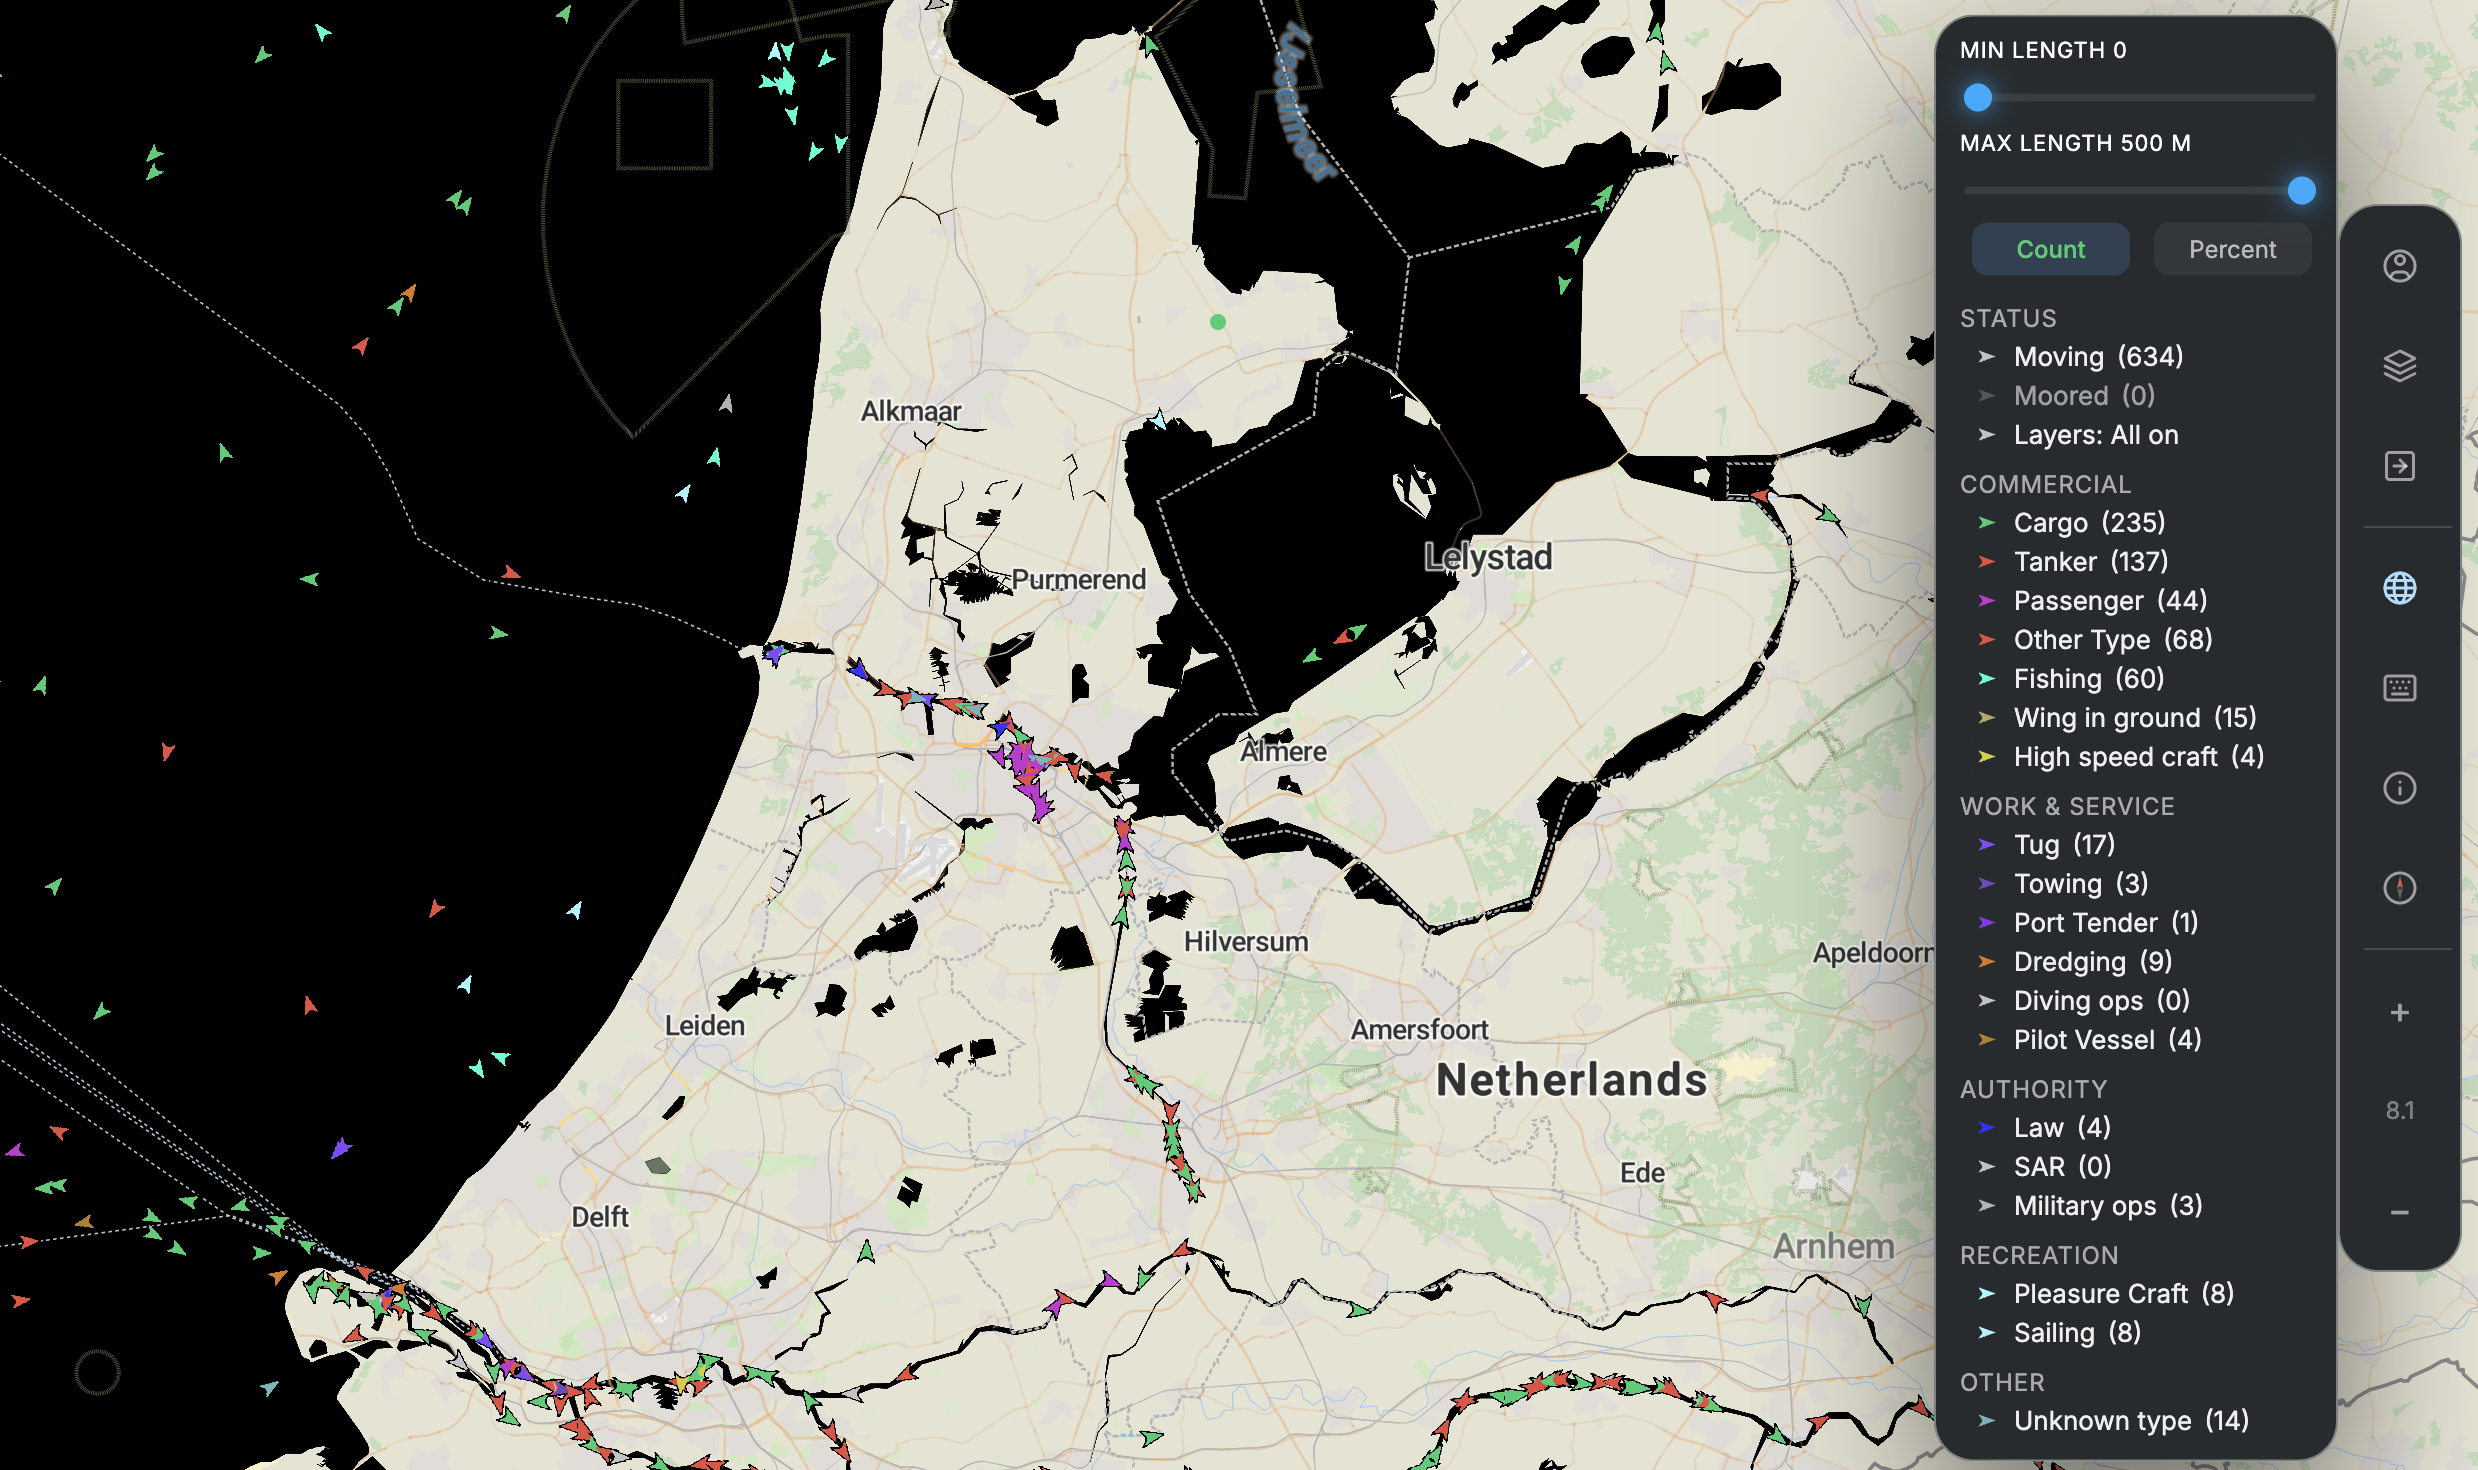
Strip the map back to the traffic that matters for your analysis.
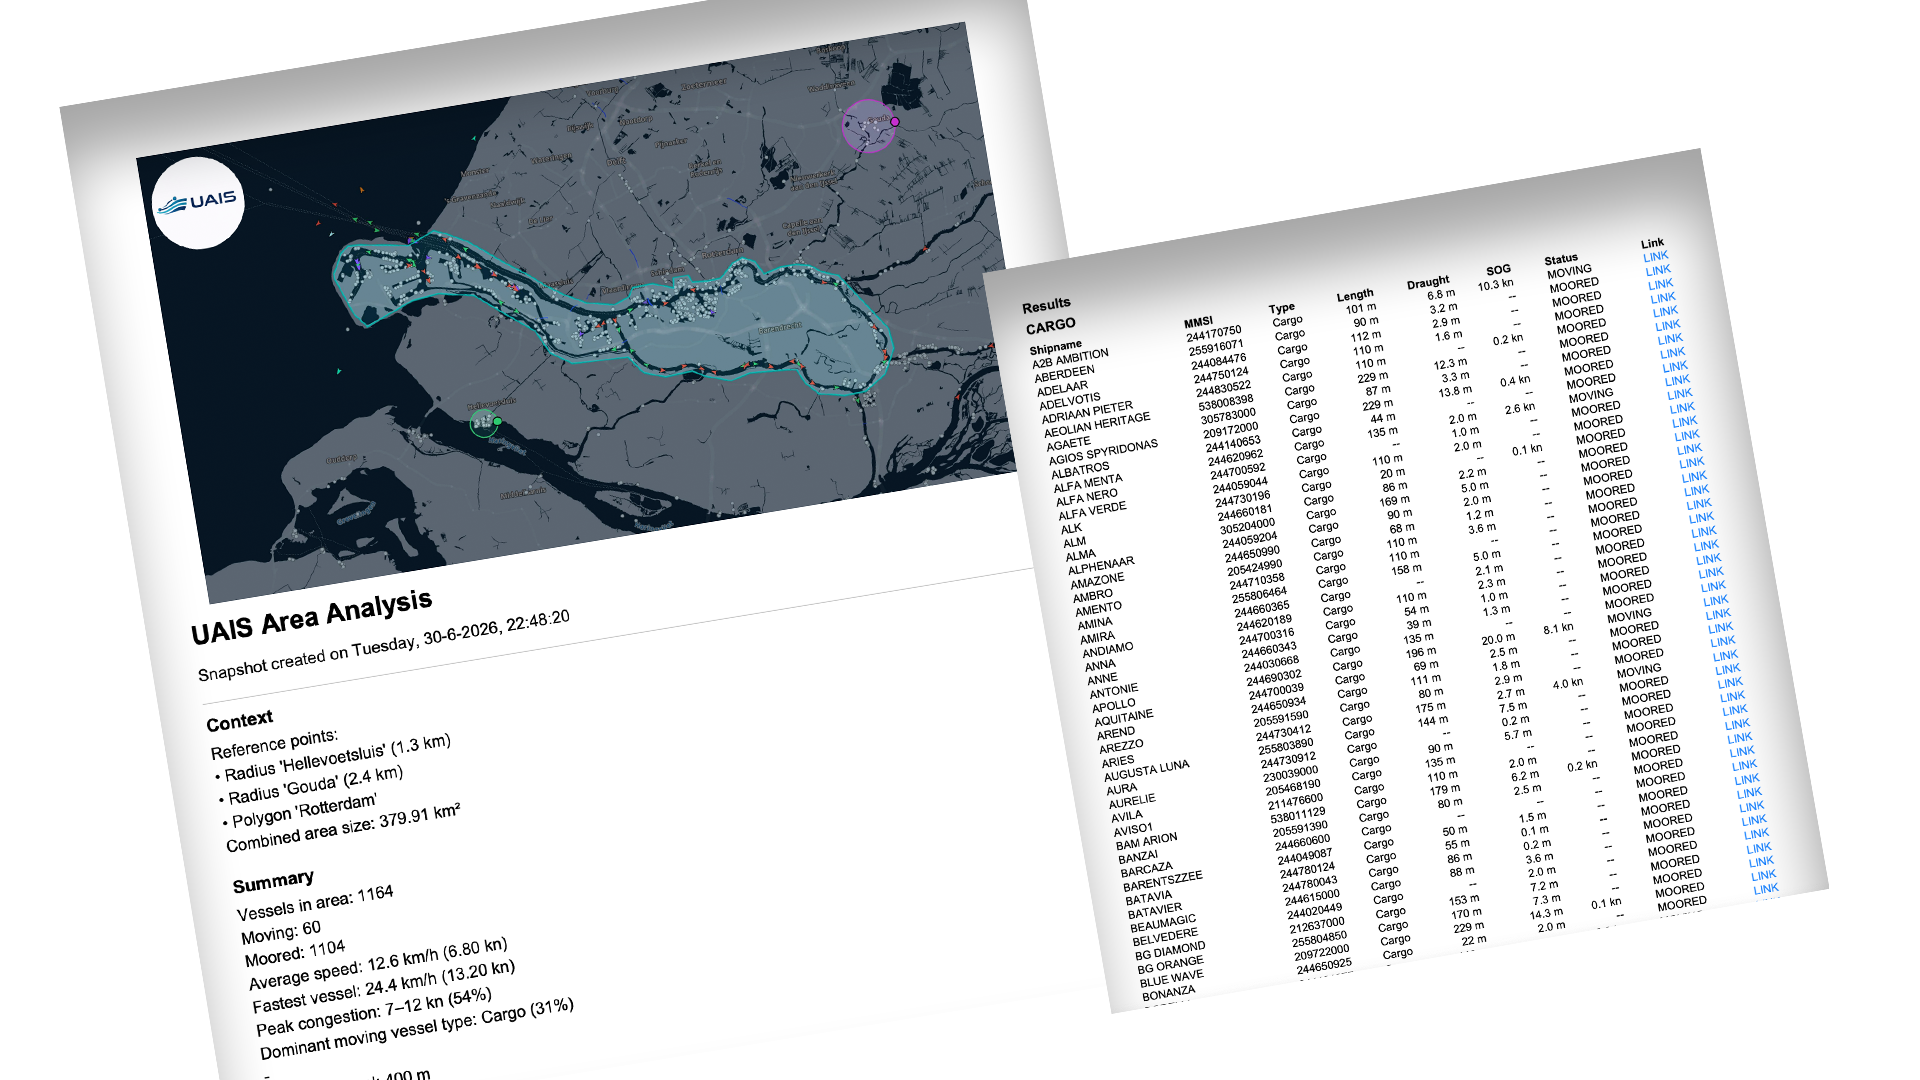
Turn your area and its numbers into a PDF report you can save and share.
Before you draw anything, Live mode gives you the current picture of every Dutch waterway and the Port of Antwerp. No date picker, no playback — the water as it is at this moment, so you can see where it's worth looking closer.
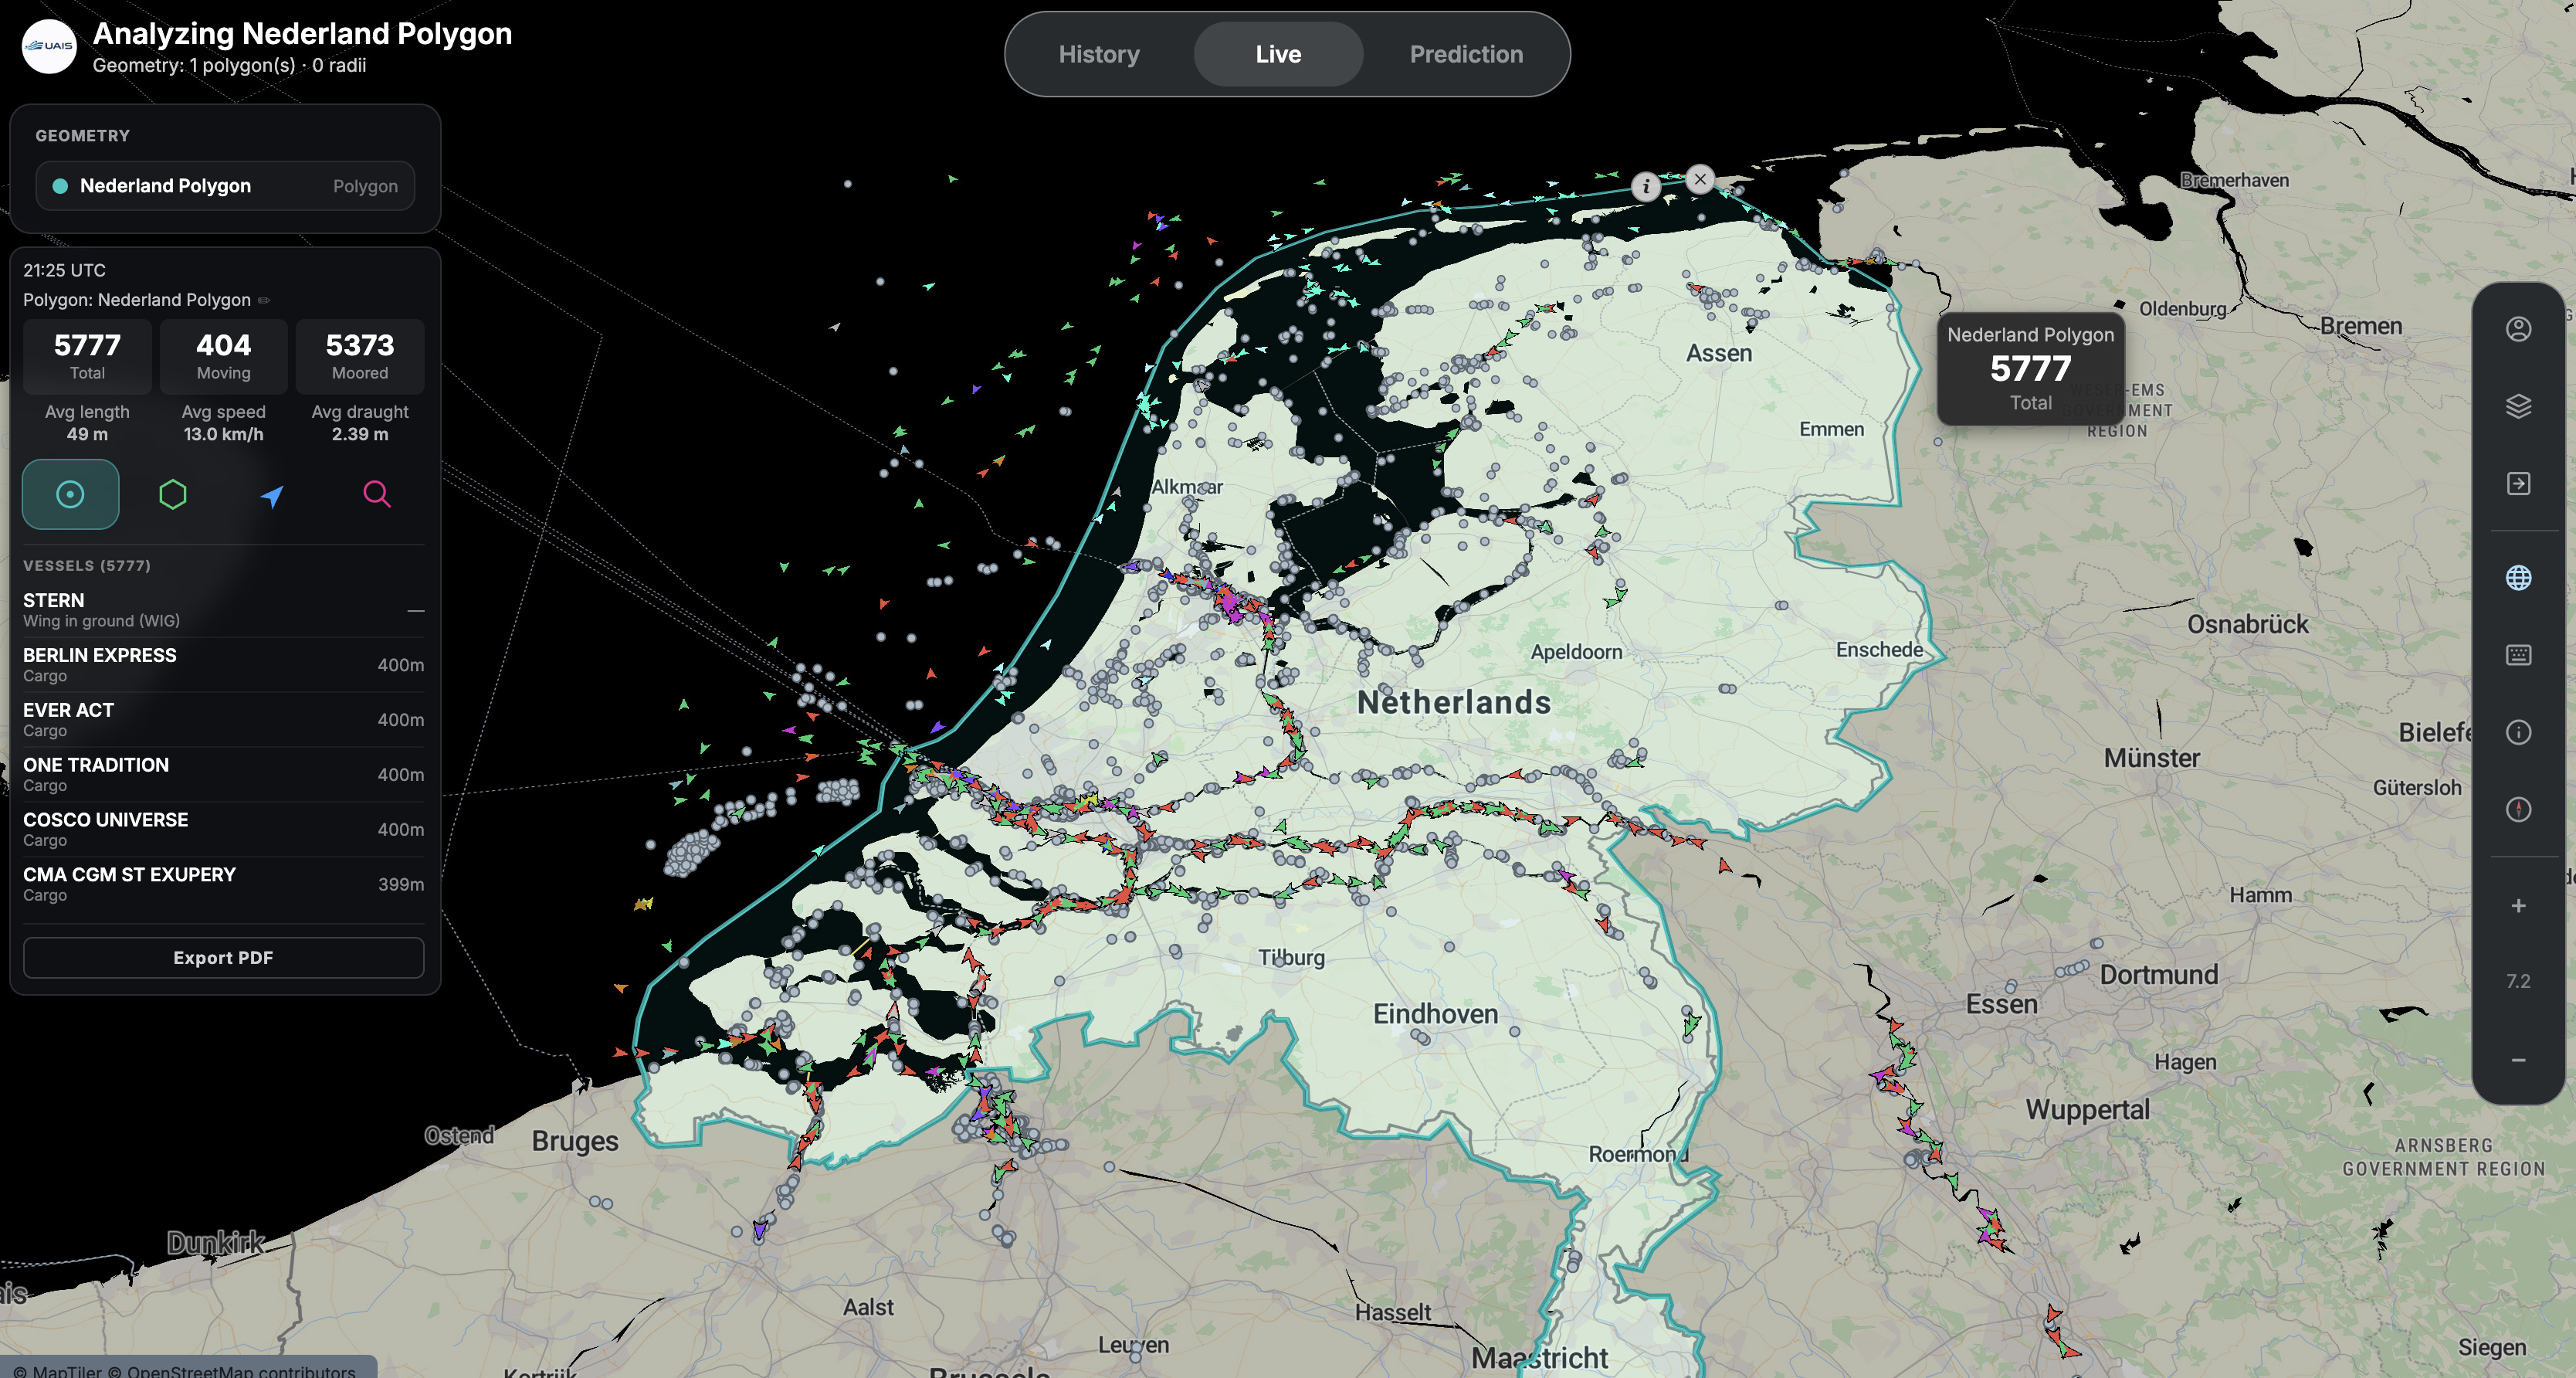
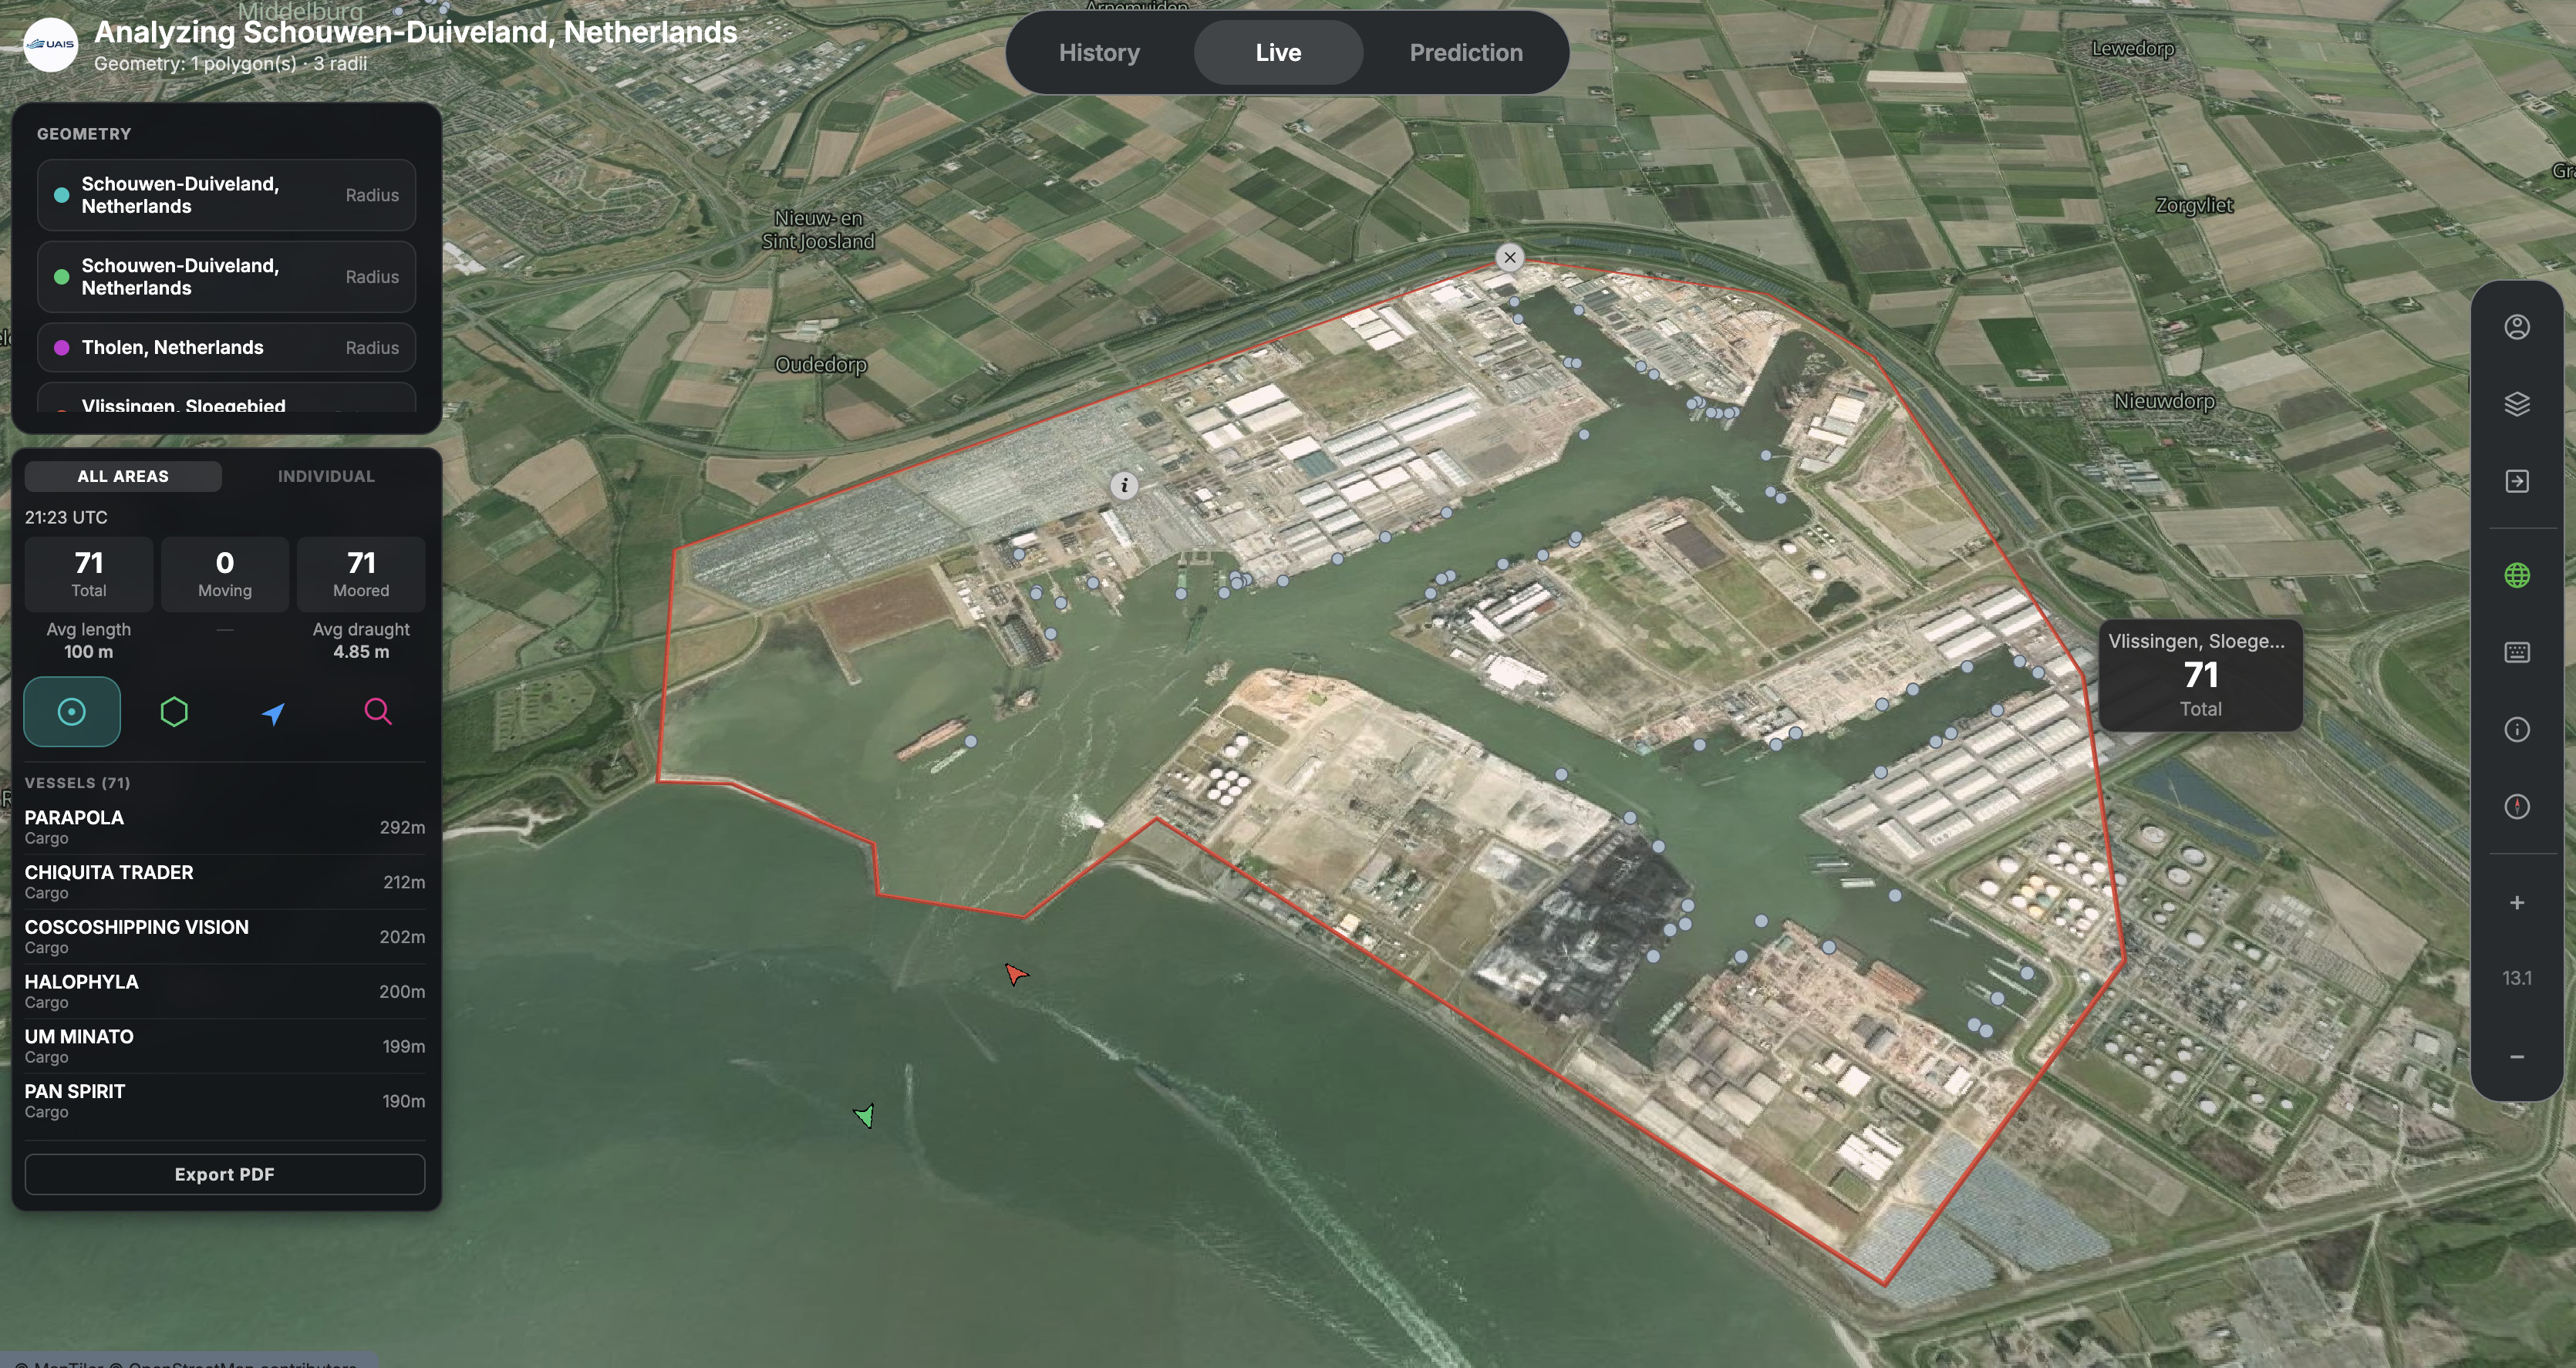
Other platforms hand you a map and let you look. UAIS lets you define the area you care about — a lock approach, a berth, a bend in the river — and answers for that area alone. Draw it, and the numbers appear.
Filter the traffic down to what you care about, and switch the basemap between Dark, Light and Satellite to give your view the right context — open water, port detail, or a clean overview.
Turn the current view into a clean PDF in one click — ready to share or file. PDF export is available across every mode in UAIS, so whatever you're looking at, you can take it with you.
Live mode is the free way into UAIS. Drop an area and explore before going any deeper.
An area that's too wide catches passing traffic. Keep it close to the real feature for a clean count.
R, P, V and / are single keys. Press S any time to see the full list of shortcuts.
Satellite for real-world context, Dark for clarity, Light for printing — pick what fits the moment.
Live mode is free and needs no account. Open UAIS, draw the spot you care about, and see what's happening there right now.