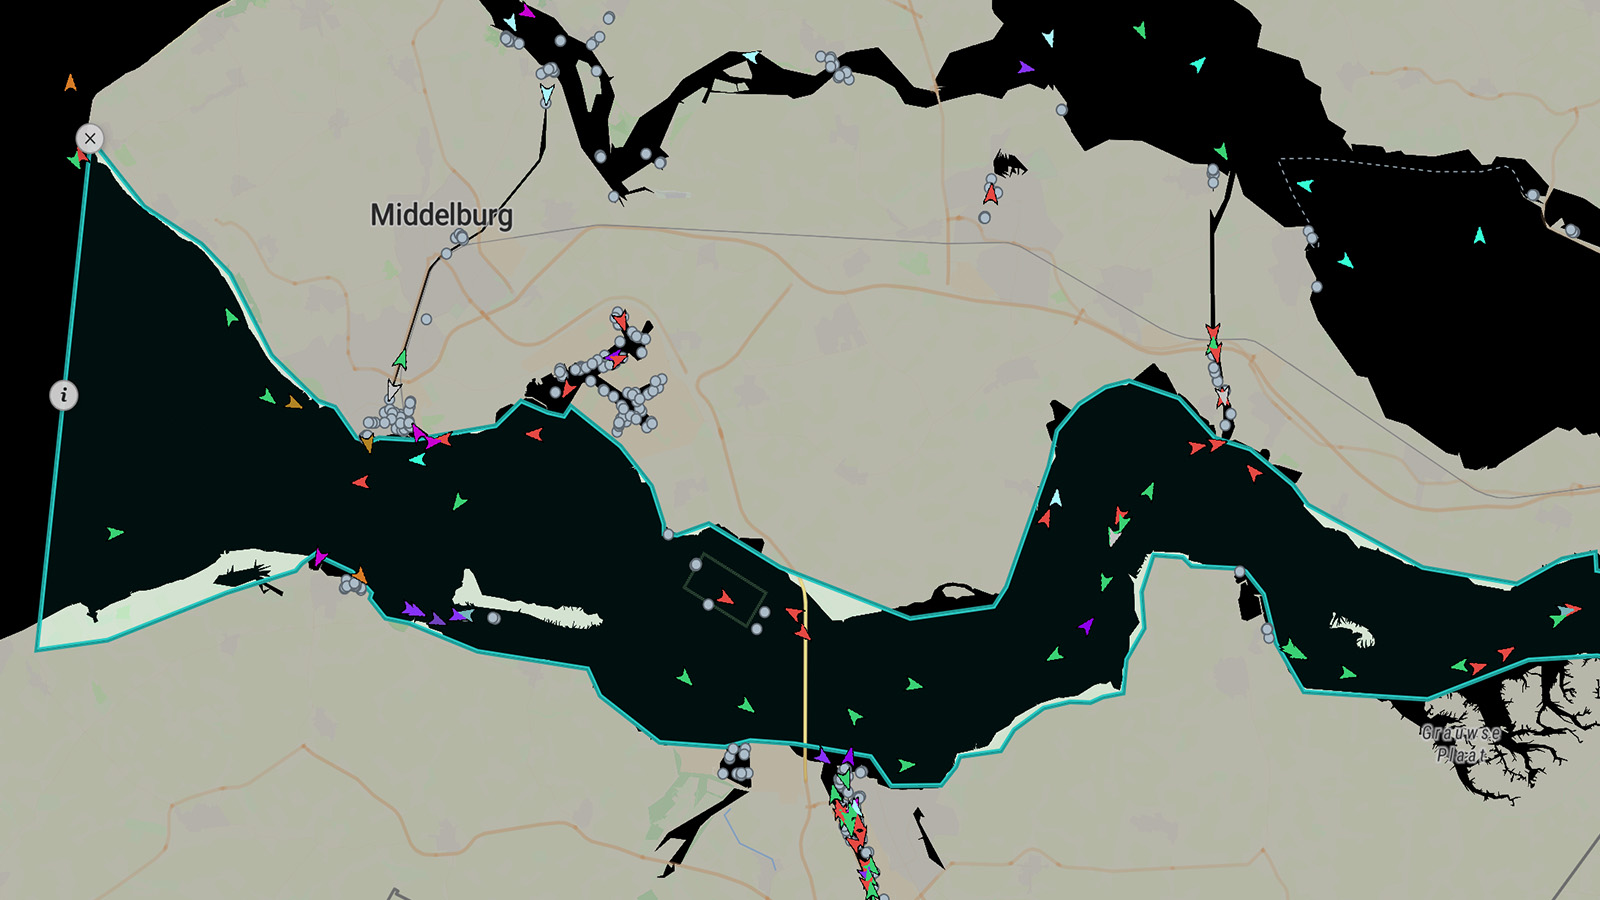
Pick a date and History mode rebuilds that day around your area — minute by minute, exactly as it happened. The same tools as Live, now pointed at the past.
Learn more ↓Pick a date, place your area, and watch that day play out inside it. Everything Live mode does works here too — on the day you chose.
Pick any day — UAIS replays the traffic as it was.
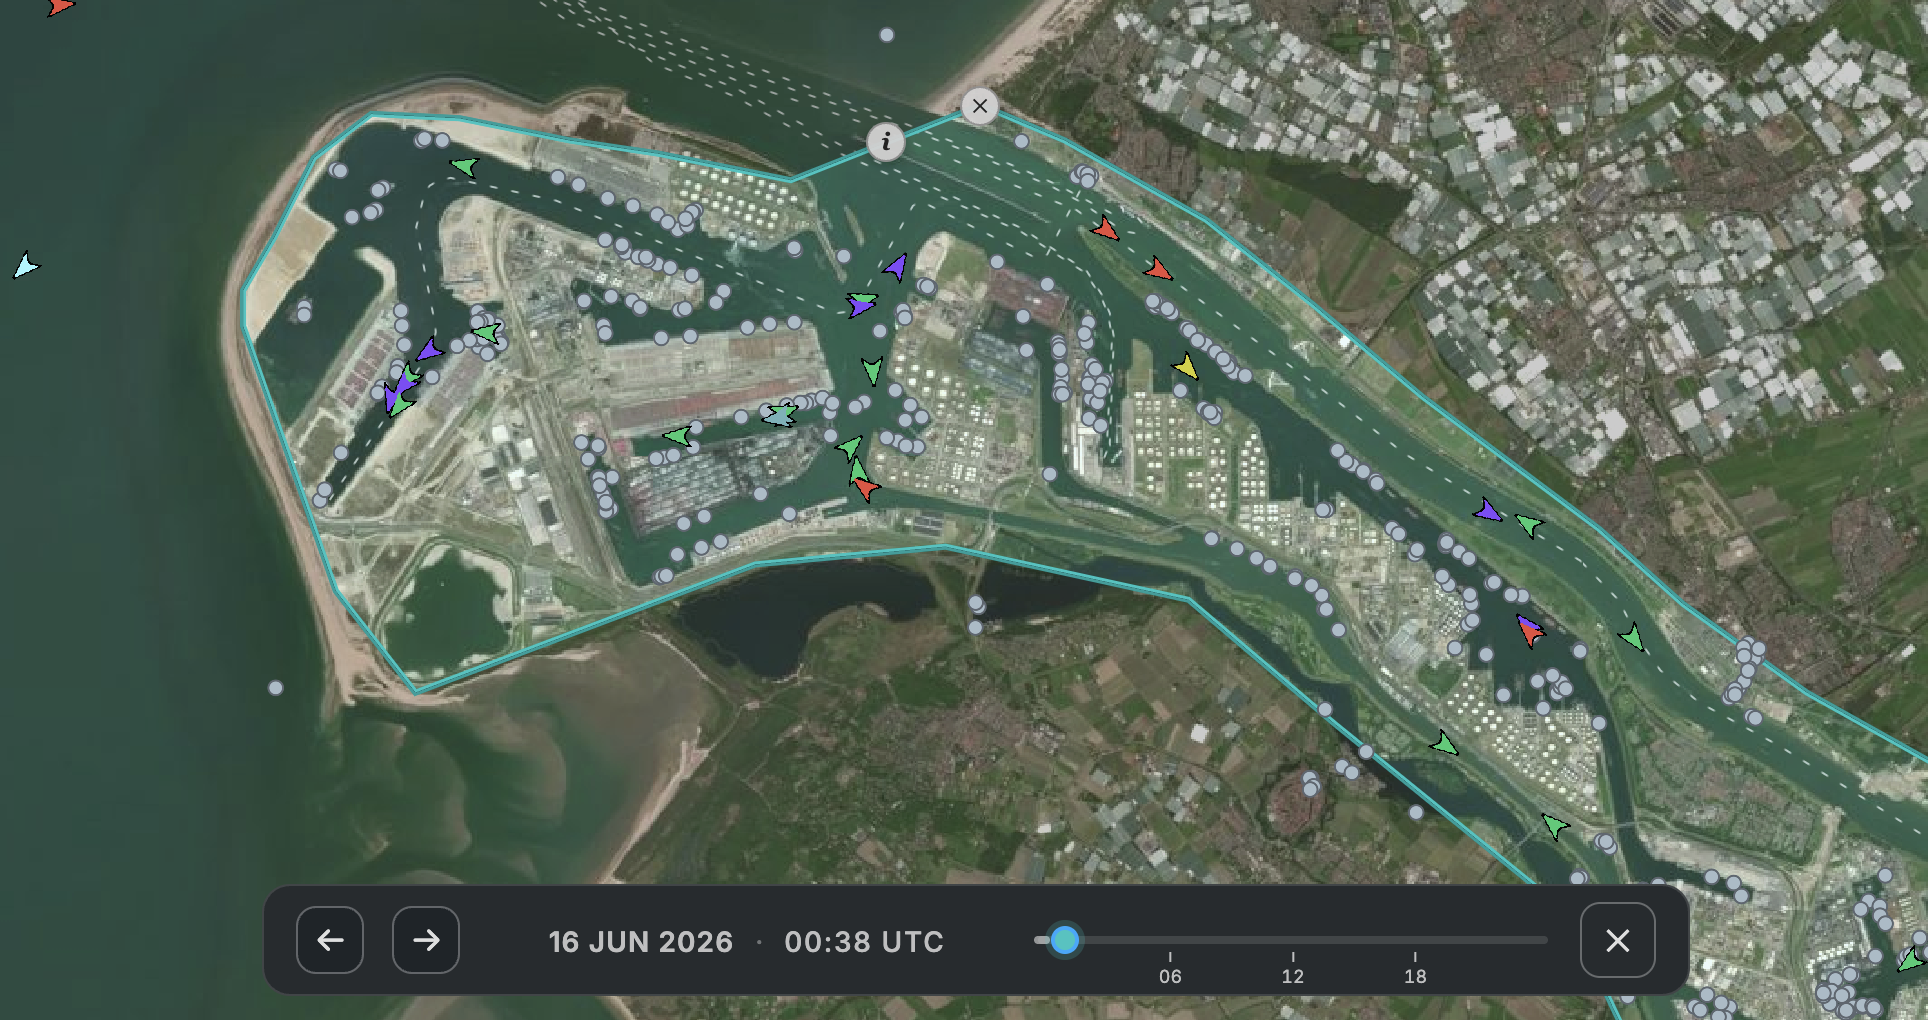
Press play and watch your area fill, queue and empty again.
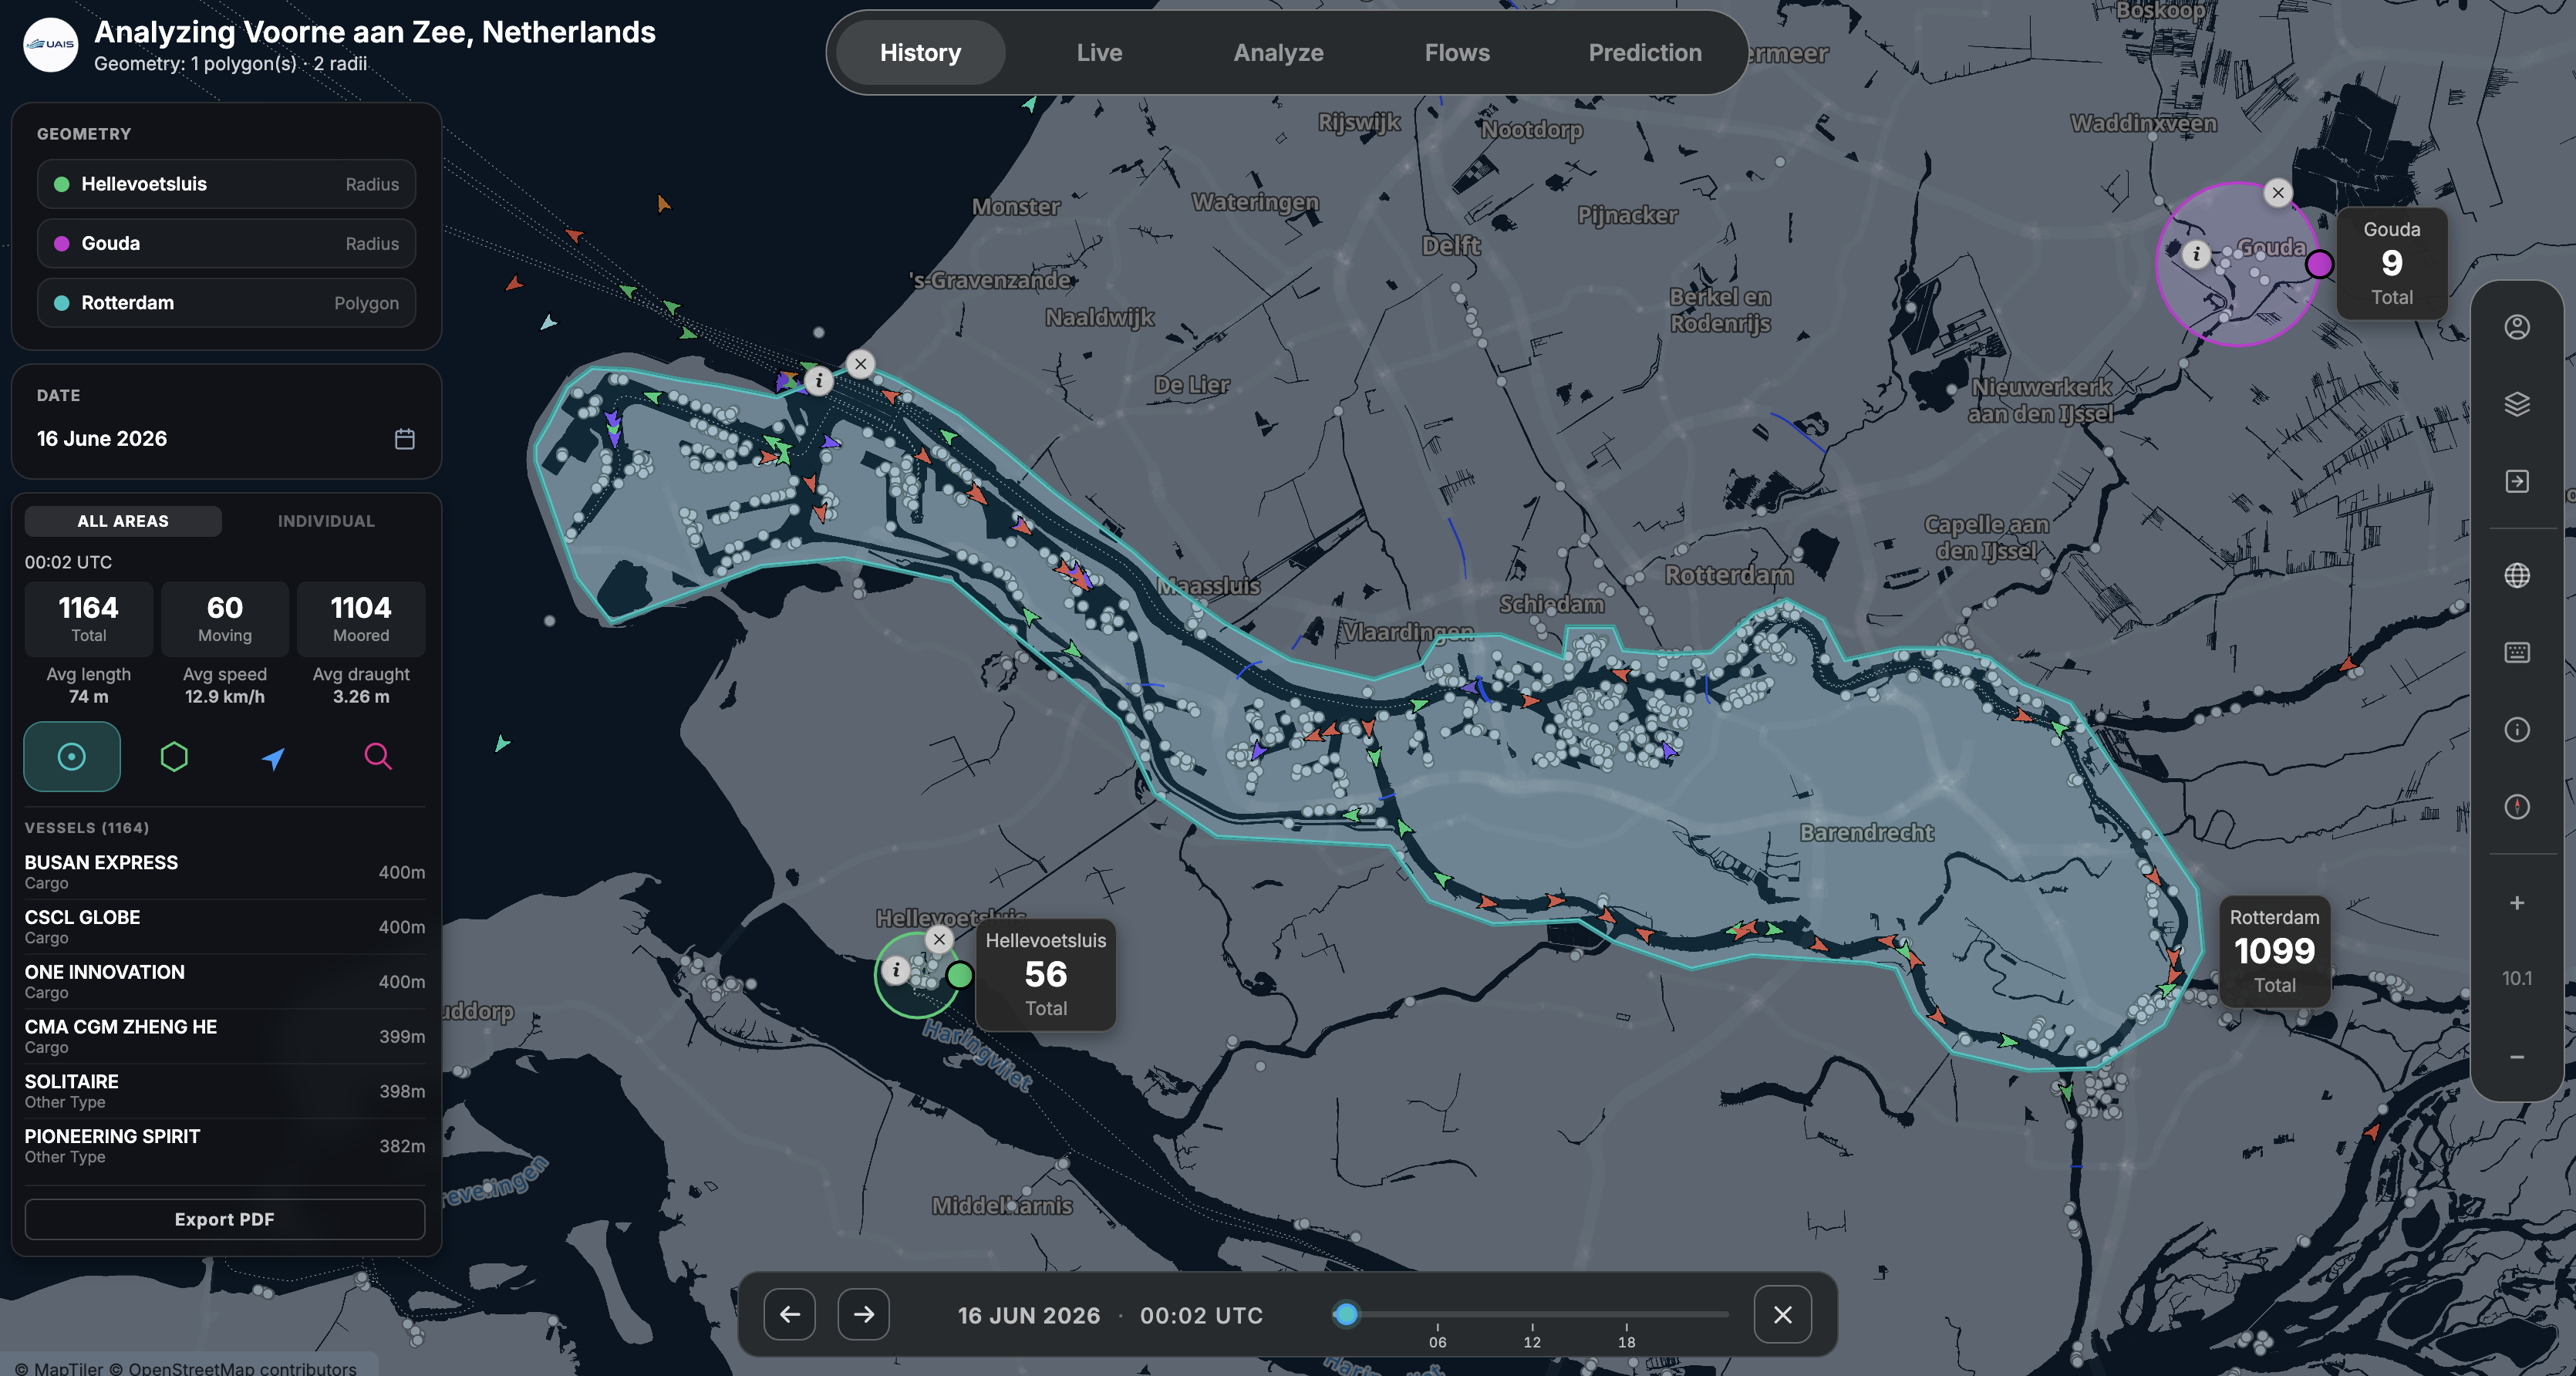
Draw the same areas as in Live — now measured against that day.
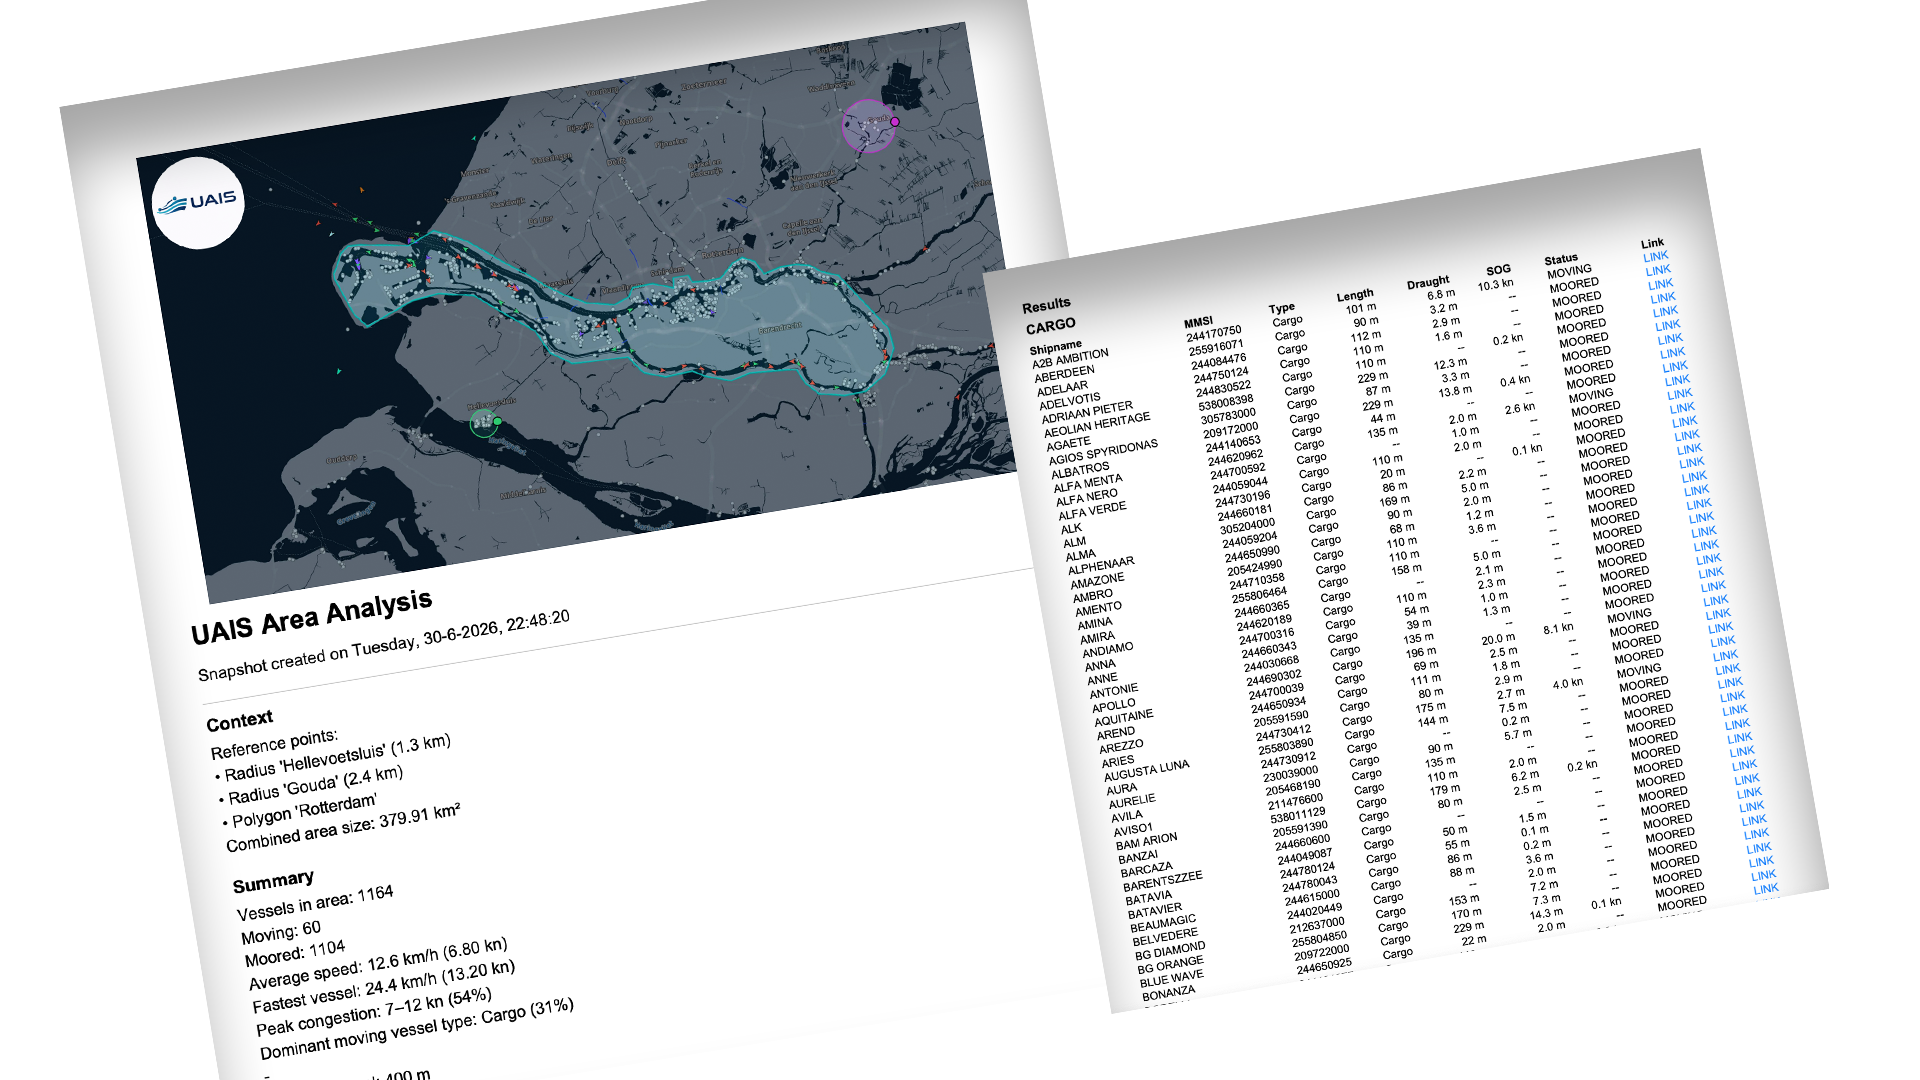
Freeze any moment in your area and share it as a PDF.
Pick the day something happened — the morning of the incident, last Tuesday's rush, that week in May. UAIS loads the recorded traffic and drops you into playback, ready for you to draw where you want to look.
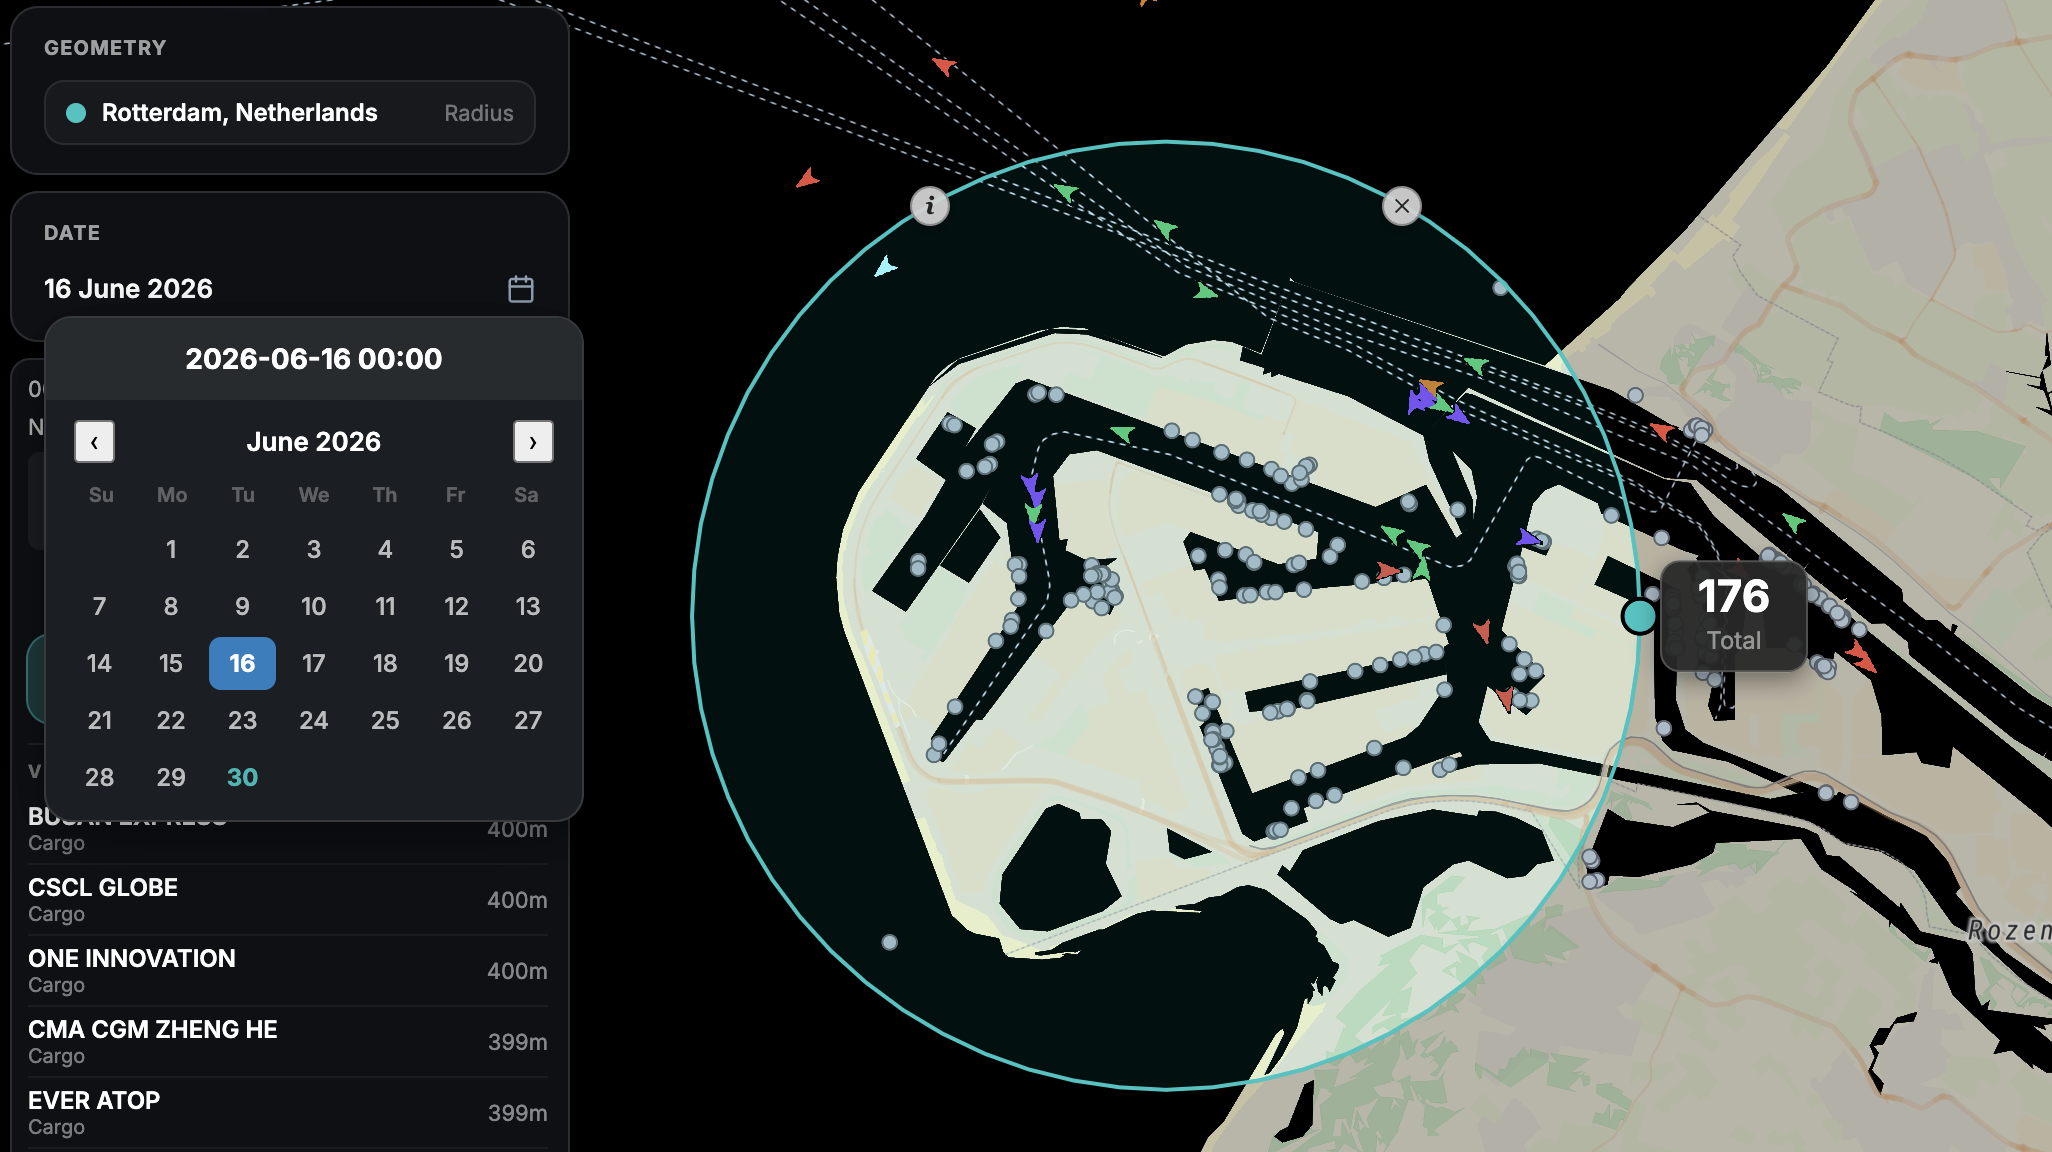
A table tells you the lock was busy at 08:00. Playback shows you the queue forming, the chamber filling, and the four vessels that waited it out. Press play and your area tells its own story.
Every area you draw can be measured, not just watched. History mode is the doorway to Analysis and Flows — both start from a day and an area you picked yourself.
Found a moment worth keeping? Export it to your account or save it as a clean PDF in one click — ready to share or archive. As everywhere in UAIS, PDF export is also available in History mode.
Want to analyse one particular day? Begin in History mode so you're working from that day's data.
Letting a day play through often reveals build-ups and rush moments you'd miss in a static view.
R, P, V and / work exactly the same here. Press S any time for see all shortcuts in a list..
Both build on a chosen day — so History mode is your starting point for the deeper tools.
Open UAIS, pick a date, draw the spot you care about, and watch that day unfold inside it.