Flows reveals the movement of vessels between two or more areas — how many travelled from one to another, and where traffic concentrates. Draw your areas on the map, then explore the connections between them.
Learn more ↓Flows lives inside the map. There's no separate page to fill in — you start from the areas you draw, in either Live or History mode.
Draw at least two areas with Radius or Polygon mode — in Live or History mode.
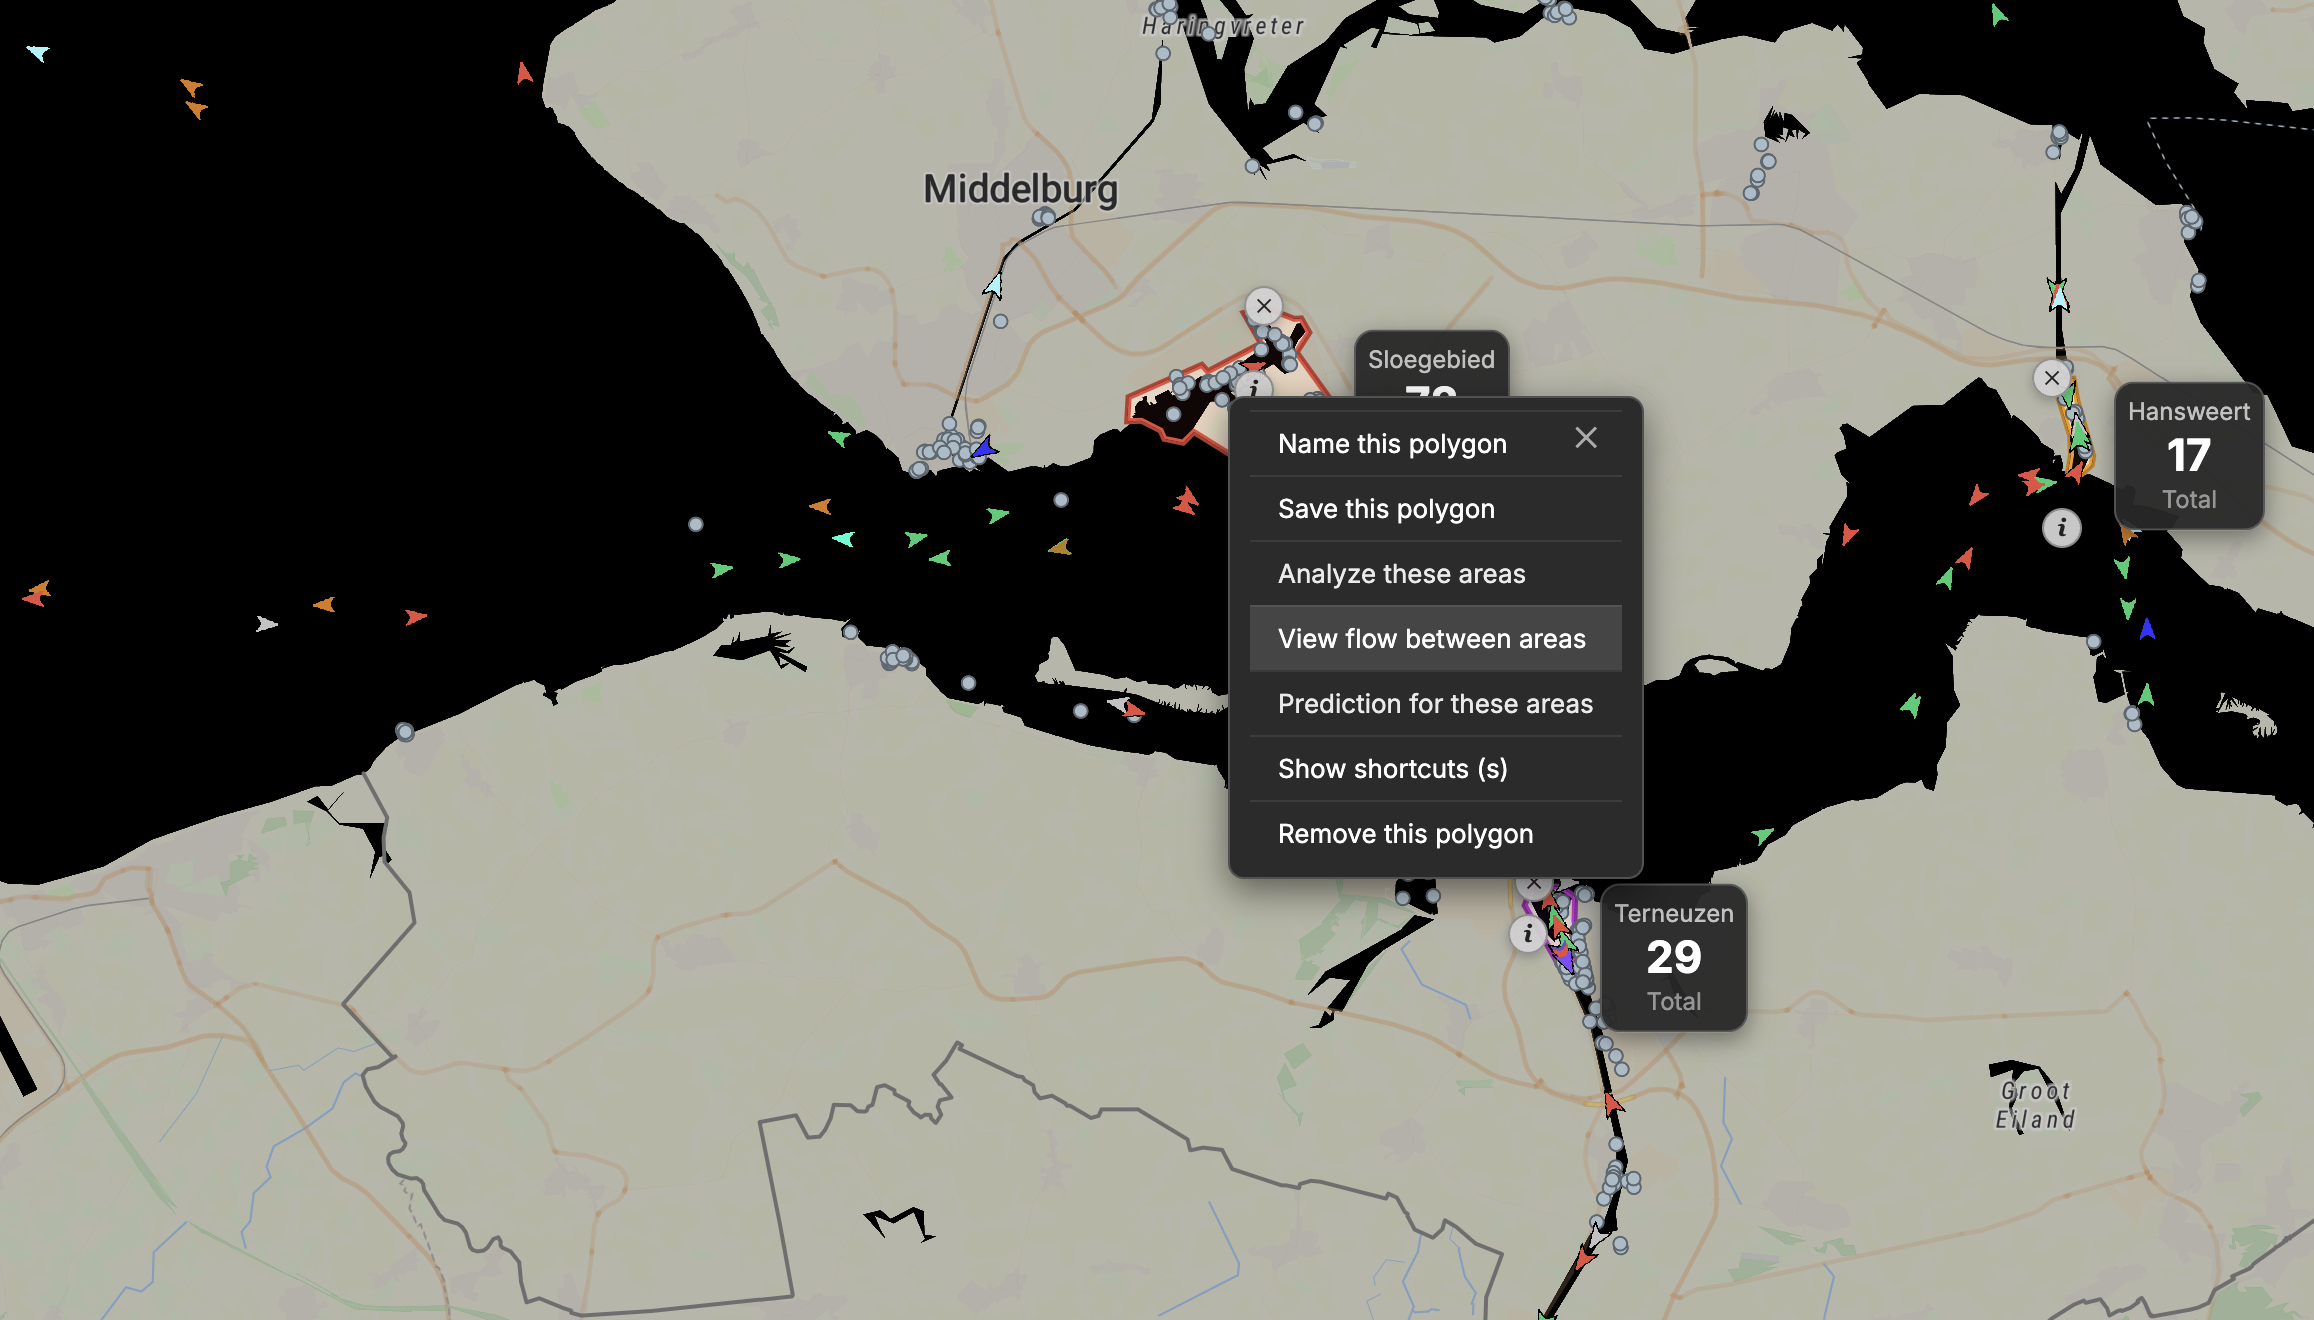
Open the context menu and choose “View flow between areas”.
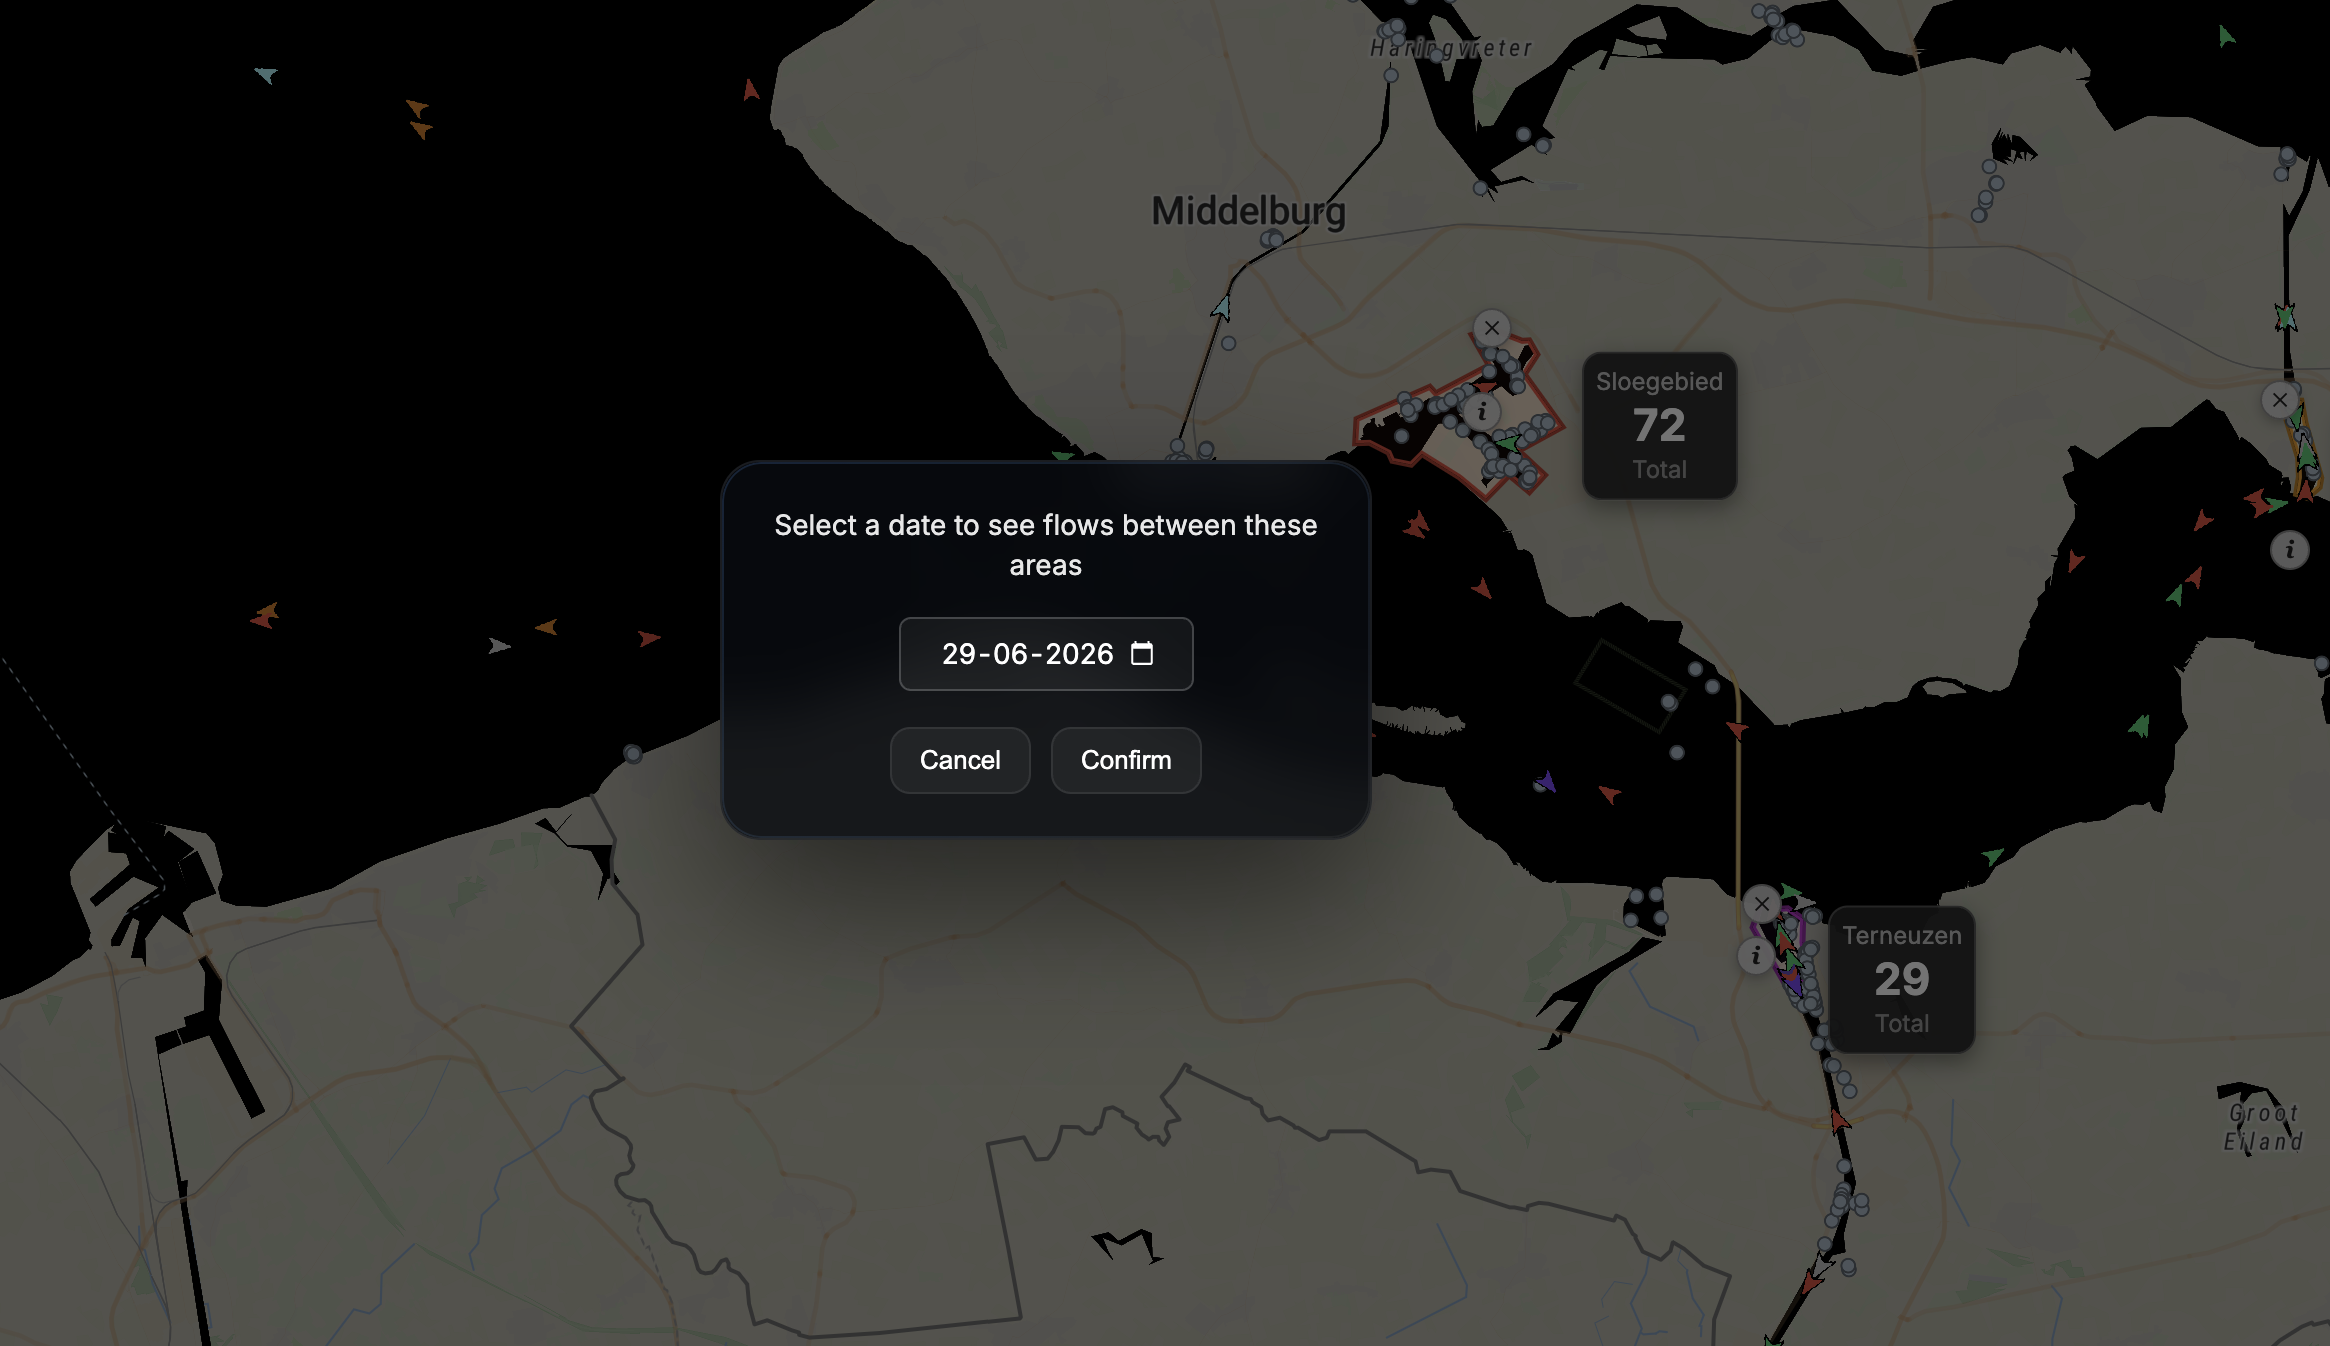
Select the day you want to analyse and confirm.
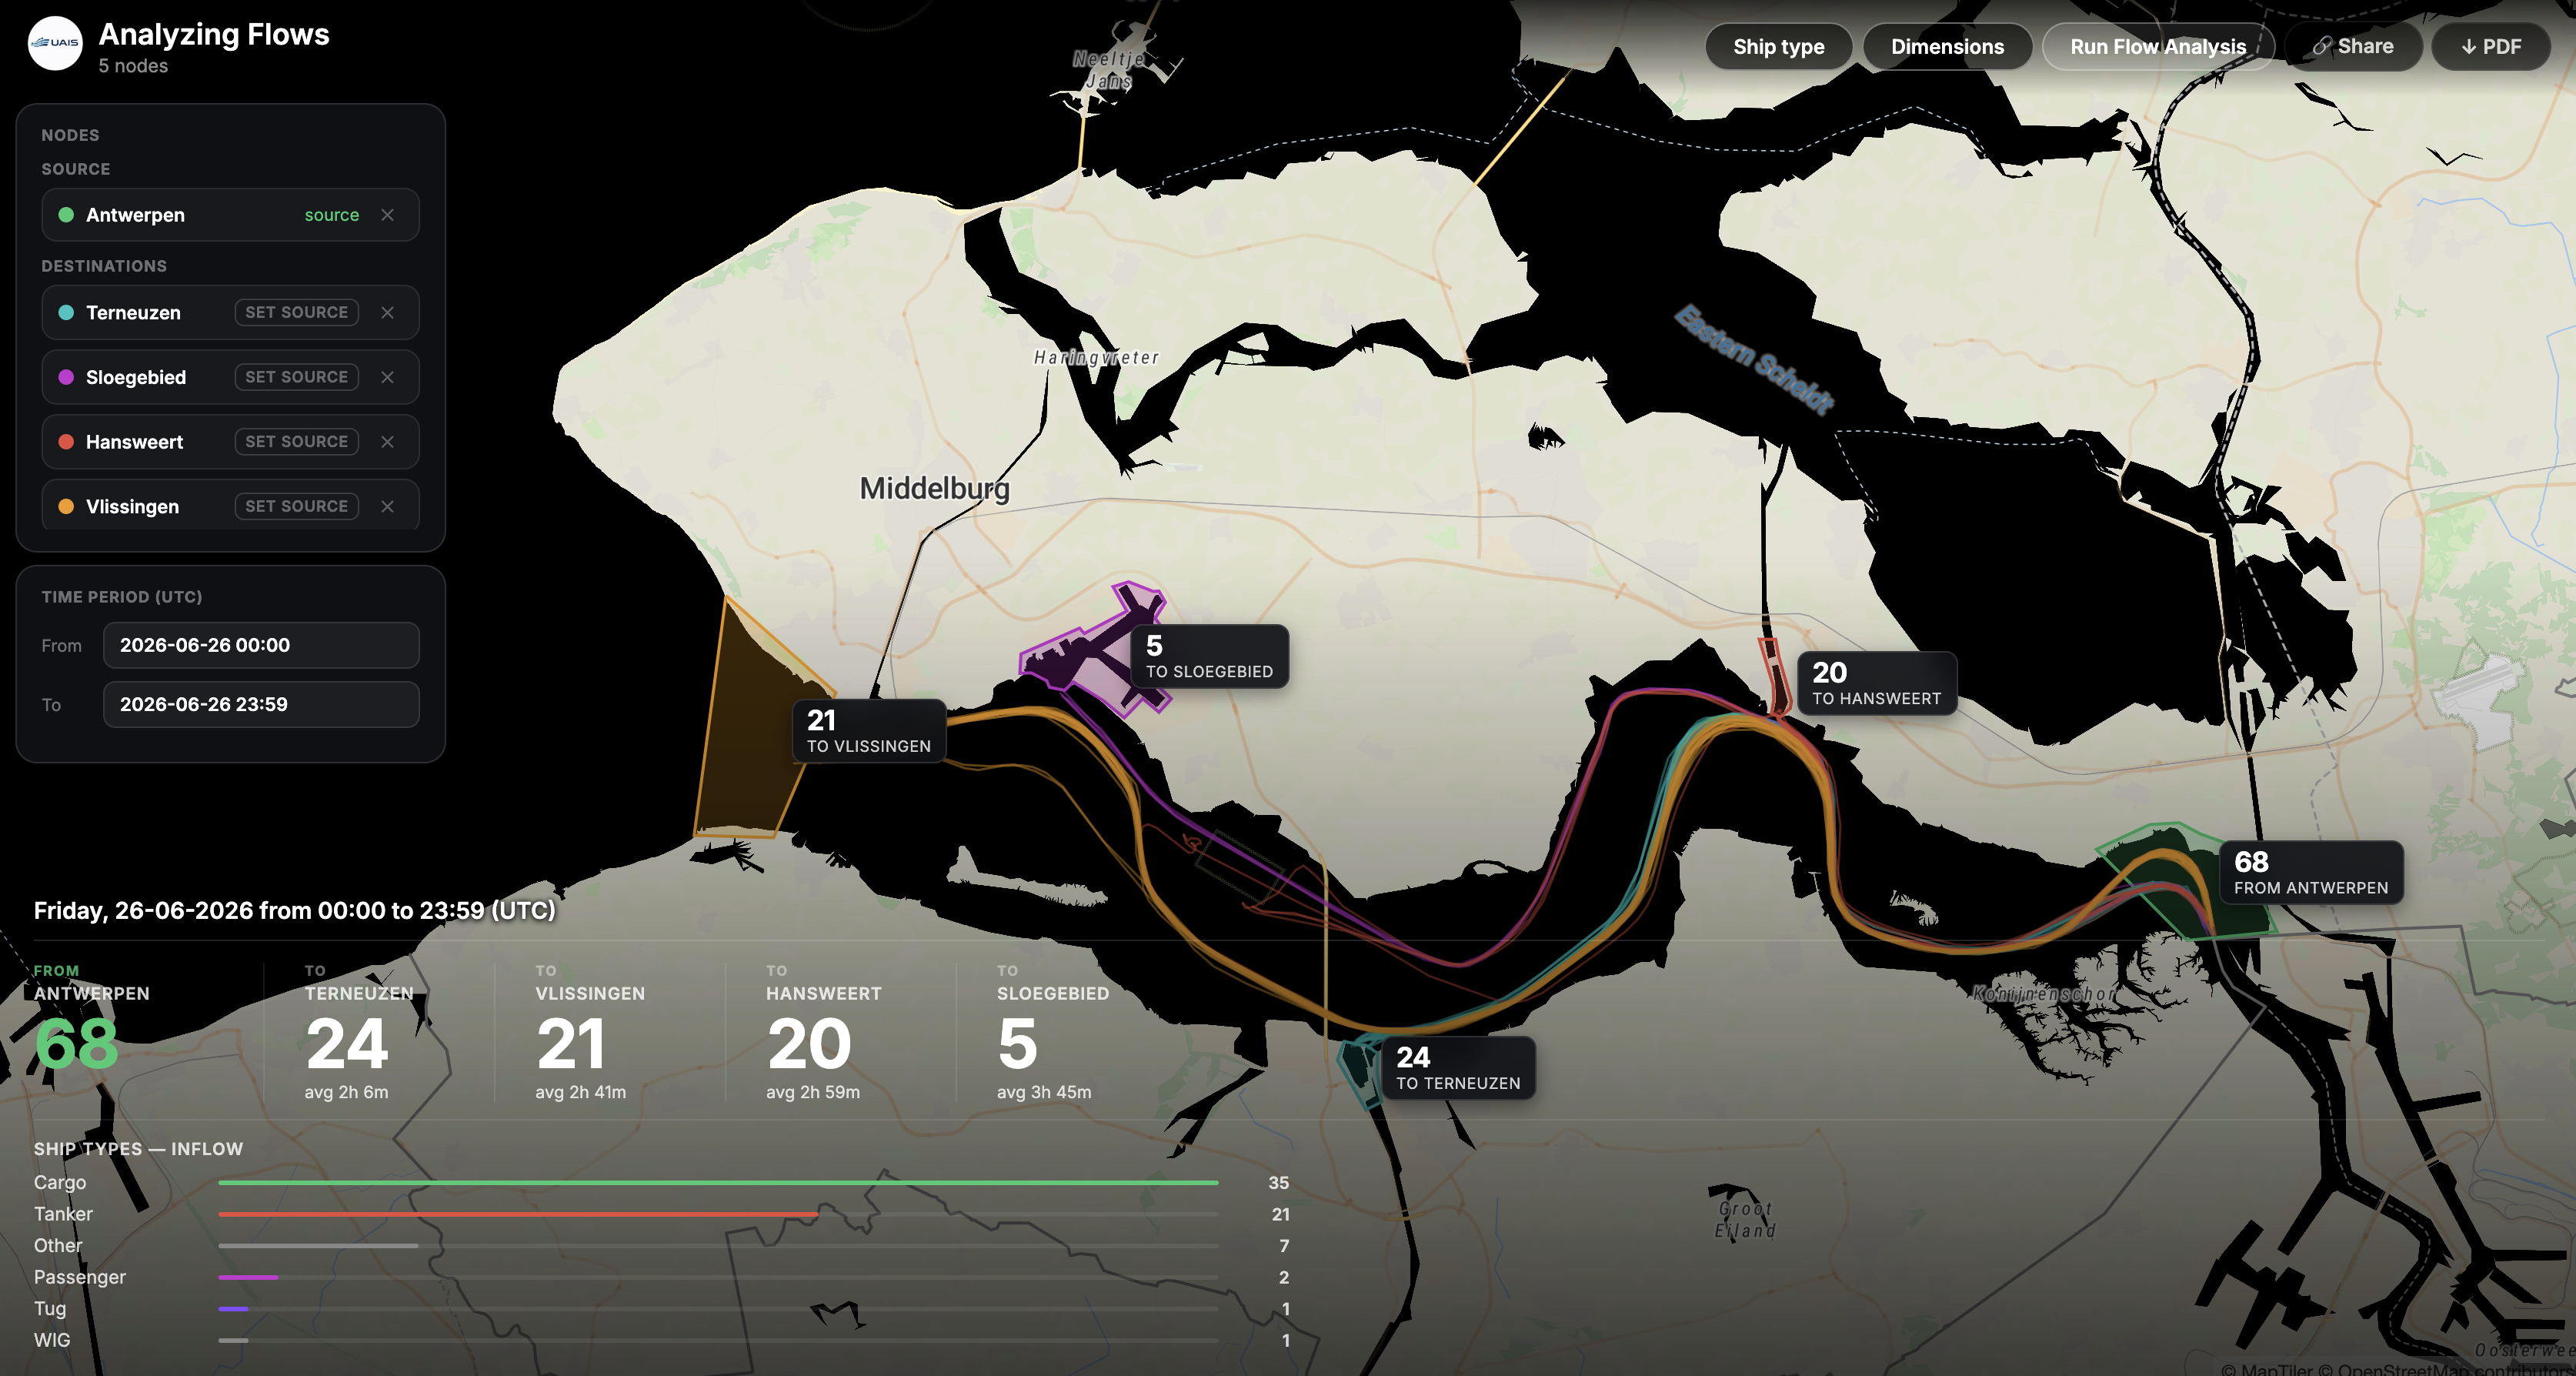
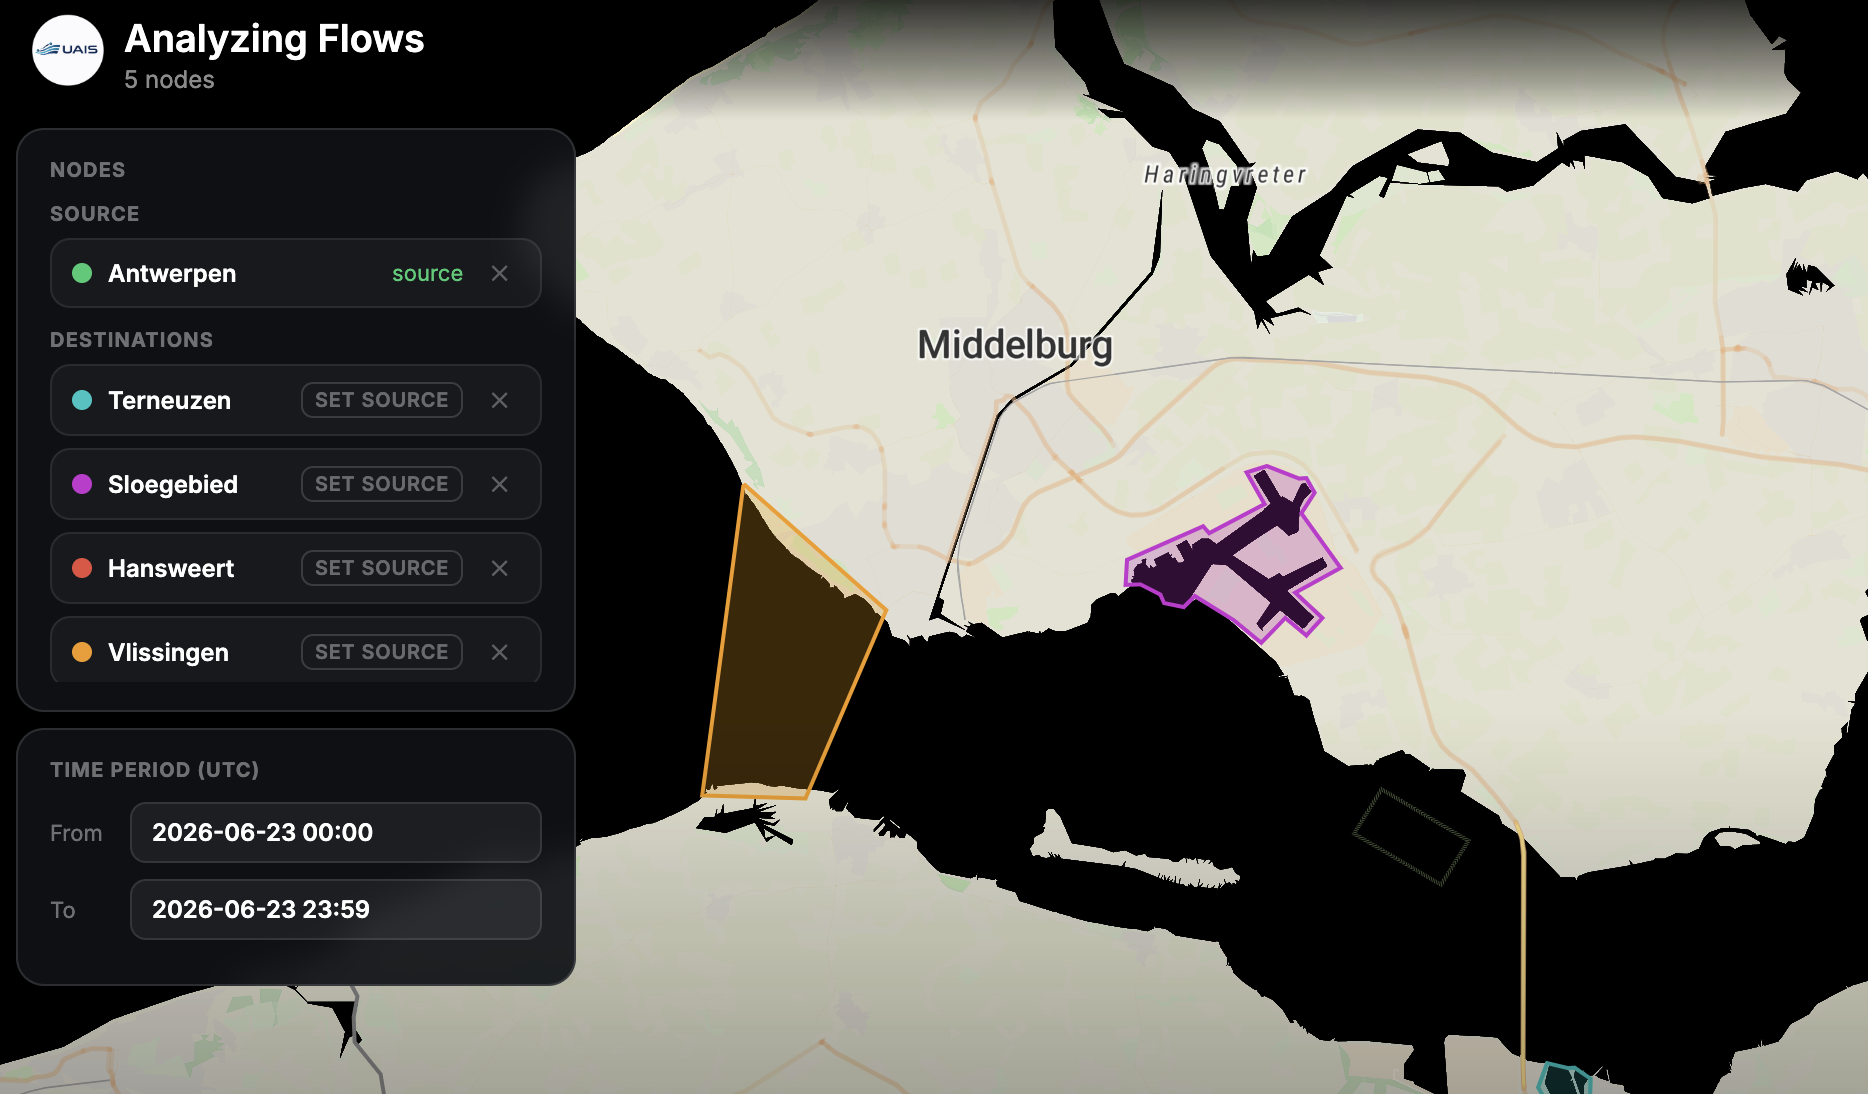
See the connections between your areas, with volume and direction at a glance.
Flows works from the areas you draw on the map. Place them in Live mode to work from the current picture, or in History mode to analyse a past day — then right-click an area and choose “View flow between areas”.
A flow is movement between areas, so you need at least two. With only one area placed, UAIS will let you know — draw a second area and you're ready to go.
Once your areas are set, choose the date you want to look at. UAIS calculates the flows between your areas for that day and draws them on the map.
UAIS draws the connections between your areas, so you can see at a glance how vessels moved between them — which routes carried the most traffic, and which connections barely registered.
Two areas show a single connection. Add more to map how traffic spreads across a whole region.
To analyse a specific day, start in History mode so you're working from that day's data.
Areas that are too wide catch passing traffic. Keep them close to the real feature for cleaner flows.
Run the same areas on different dates to see how flows shift over time.
Flows lives inside UAIS. Open the map, place at least two areas, and right-click to choose “View flow between areas”.