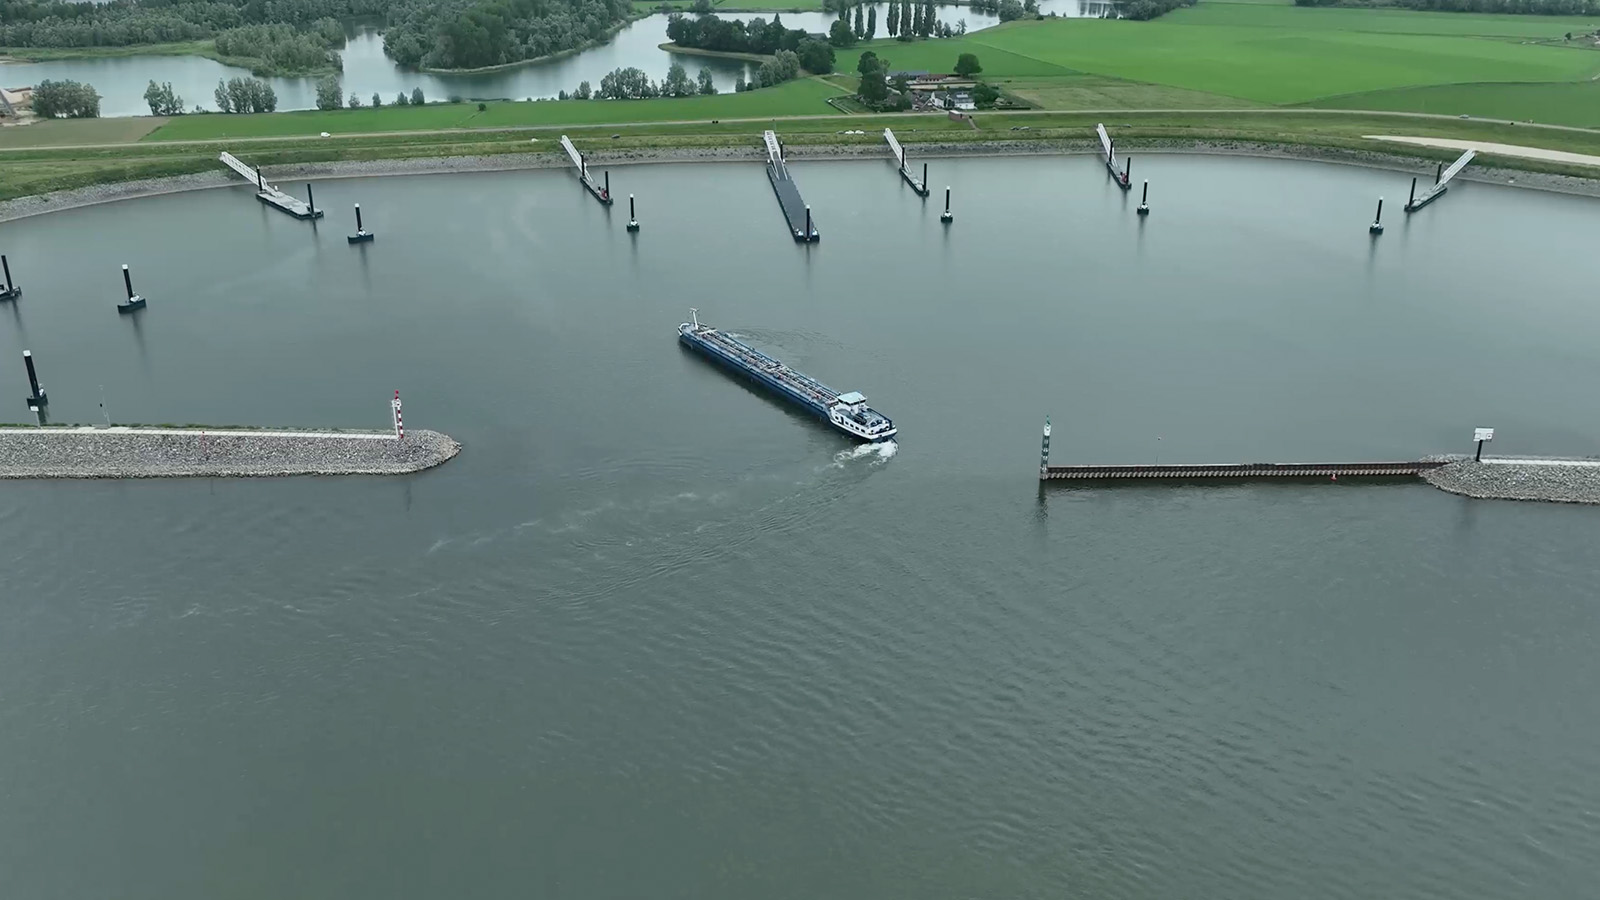
Draw an area around your port or terminal and UAIS shows every vessel that passed through, arrived, or stayed — moored or moving.
Learn more ↓You only need History mode and one geometry around the area you want to analyse. UAIS does the rest.
Press H or click the History pill at the top of the map. Select the date you want to analyse.
Use P (polygon) or Shift+click (radius) to place a geometry around your port or terminal.
Click the Analyze pill that appears at the top, or right-click a geometry and choose Analyze this area.
Select Port as the area type and click Run. Results appear within seconds.
UAIS tracks every vessel that enters your area, distinguishing moving and moored traffic using speed over ground — so you see exactly who passed through, who arrived, and who stayed.
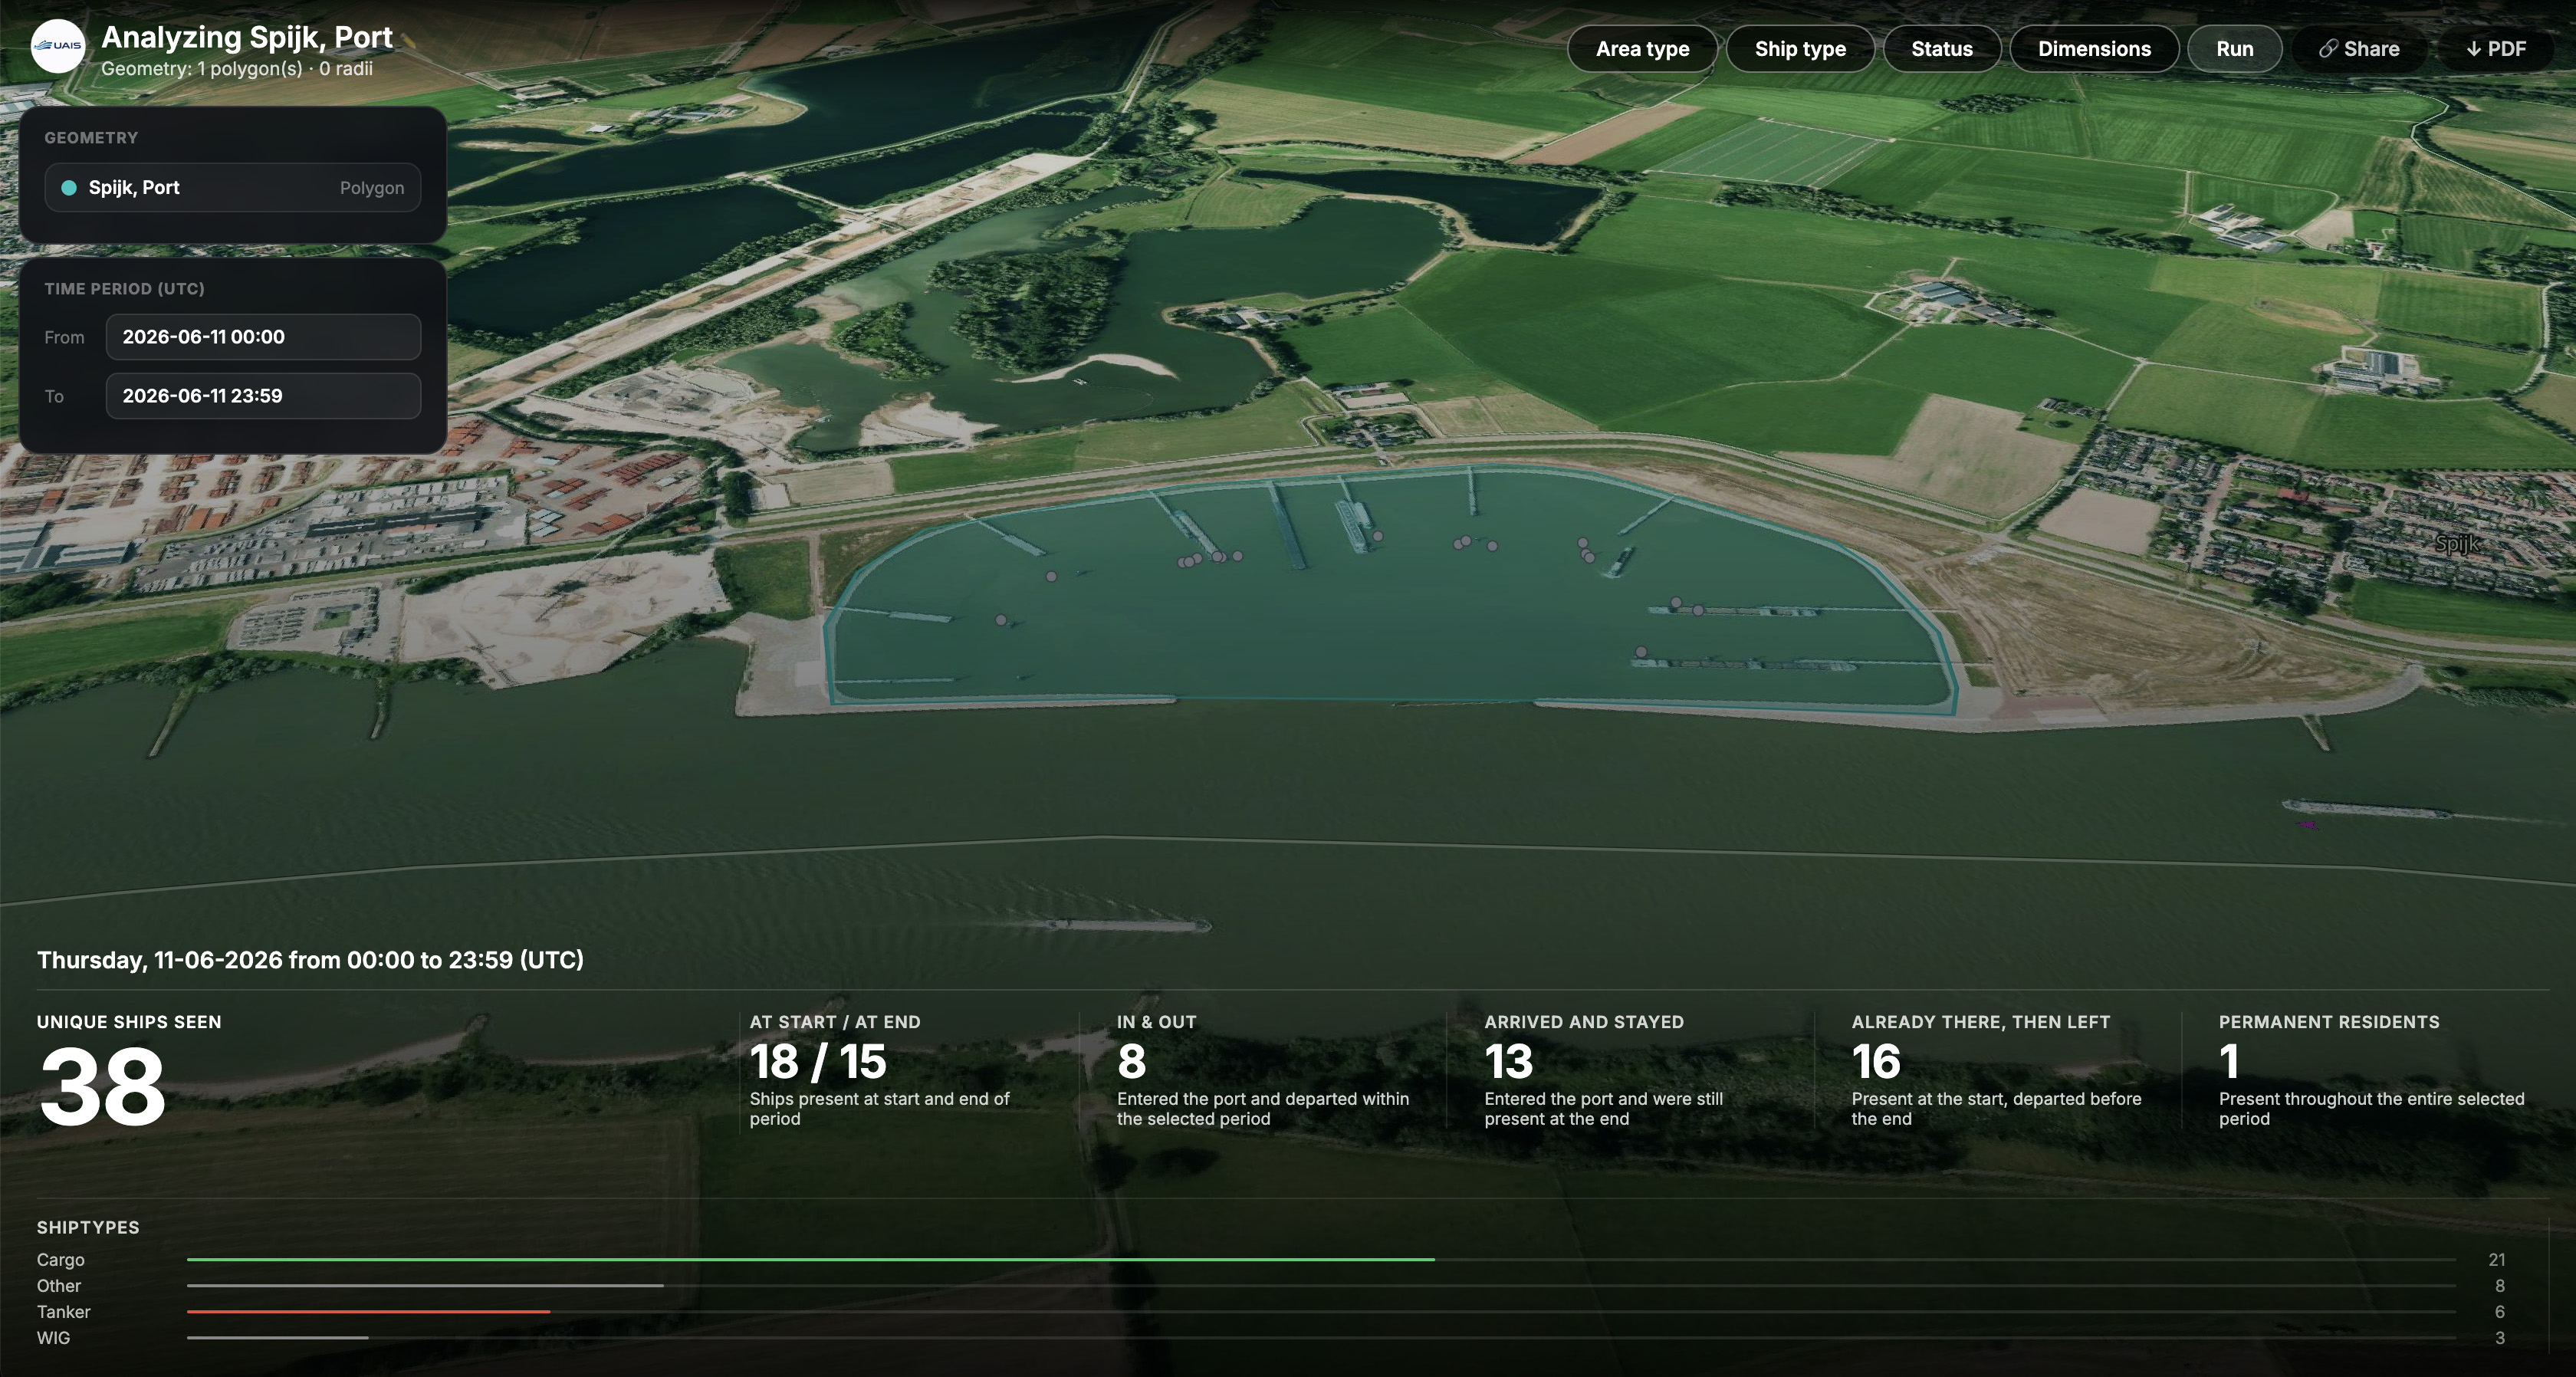
Draw the polygon tightly around the port basin or terminal. A geometry that is too wide may pick up vessels on a nearby corridor or passing traffic.
Run the same analysis for business hours versus a full day to understand how occupancy and traffic shift throughout the day.
Use the filters to focus on specific vessel types, or set minimum length, beam or draught to isolate the traffic you care about.
Share a direct link to this analysis with colleagues, or save the results as a PDF report for offline use.
Open UAIS, start History mode and place a geometry around a port or terminal near you.