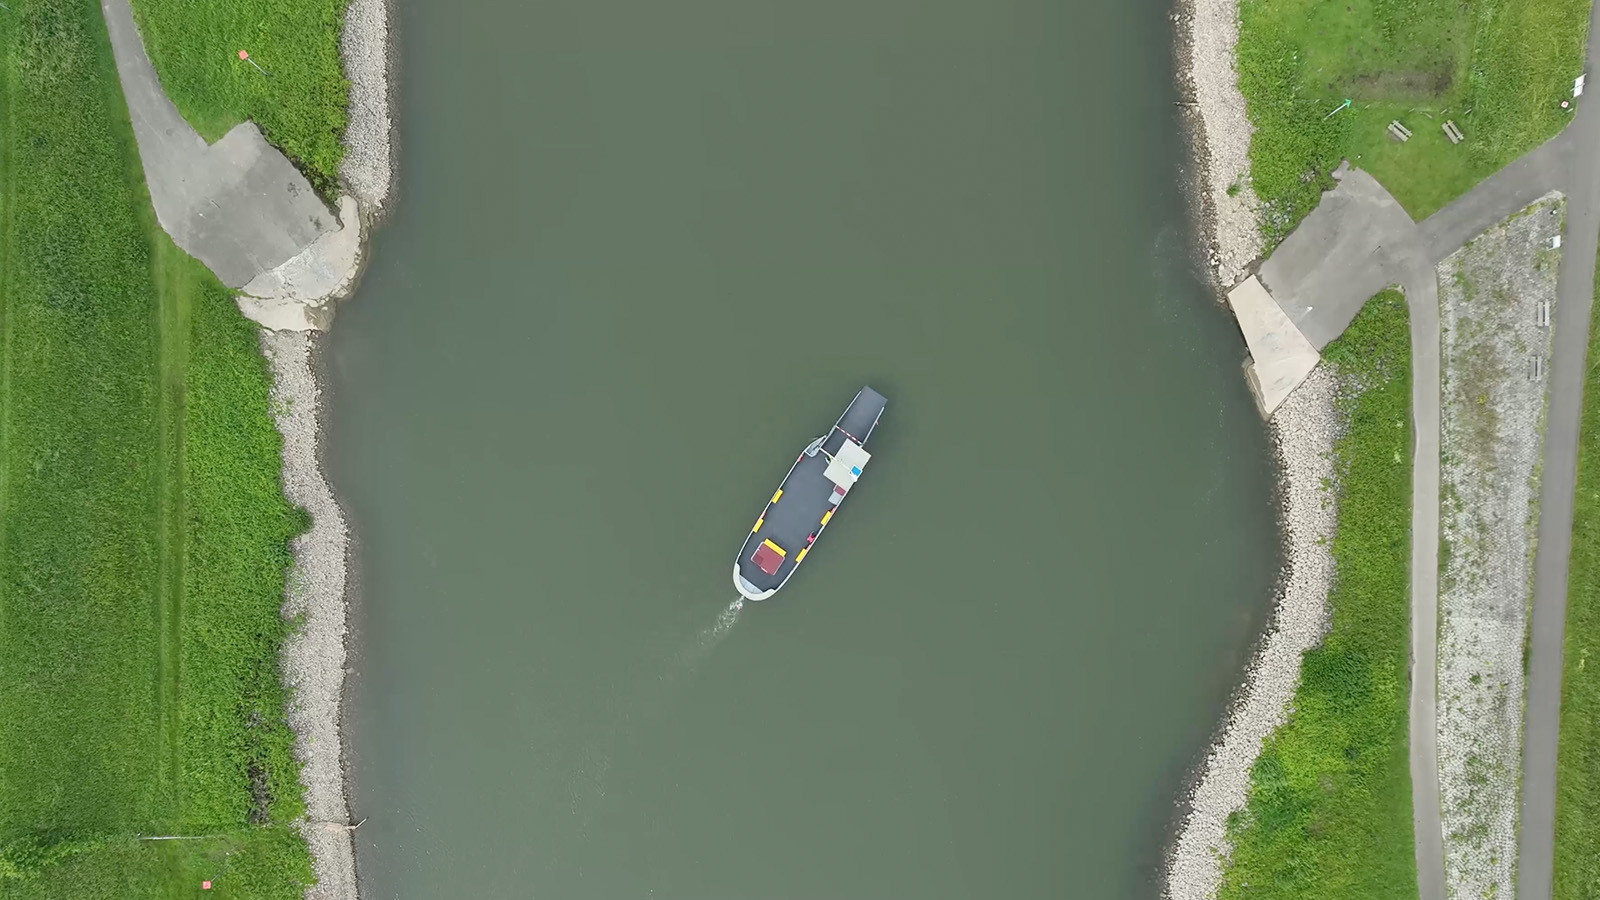
Draw a polygon on each bank of a ferry route and UAIS automatically detects every crossing — how many, how fast, and when the service is busiest.
Learn more ↓You only need History mode and two geometries — one on each bank. UAIS does the rest.
Press H or click the History pill at the top of the map. Select the date you want to analyse.
For accuracy, use P (polygon) to place one polygon on each bank of the ferry route.
Click the Analyze pill that appears at the top, or right-click a geometry and choose Analyze this area.
Select Ferry route (A–B) as the area type and click Run. Results appear within seconds.
UAIS detects each crossing using course over ground (COG) and speed — distinguishing real crossings from vessels simply waiting near the bank — and plots them on a timeline across the day.
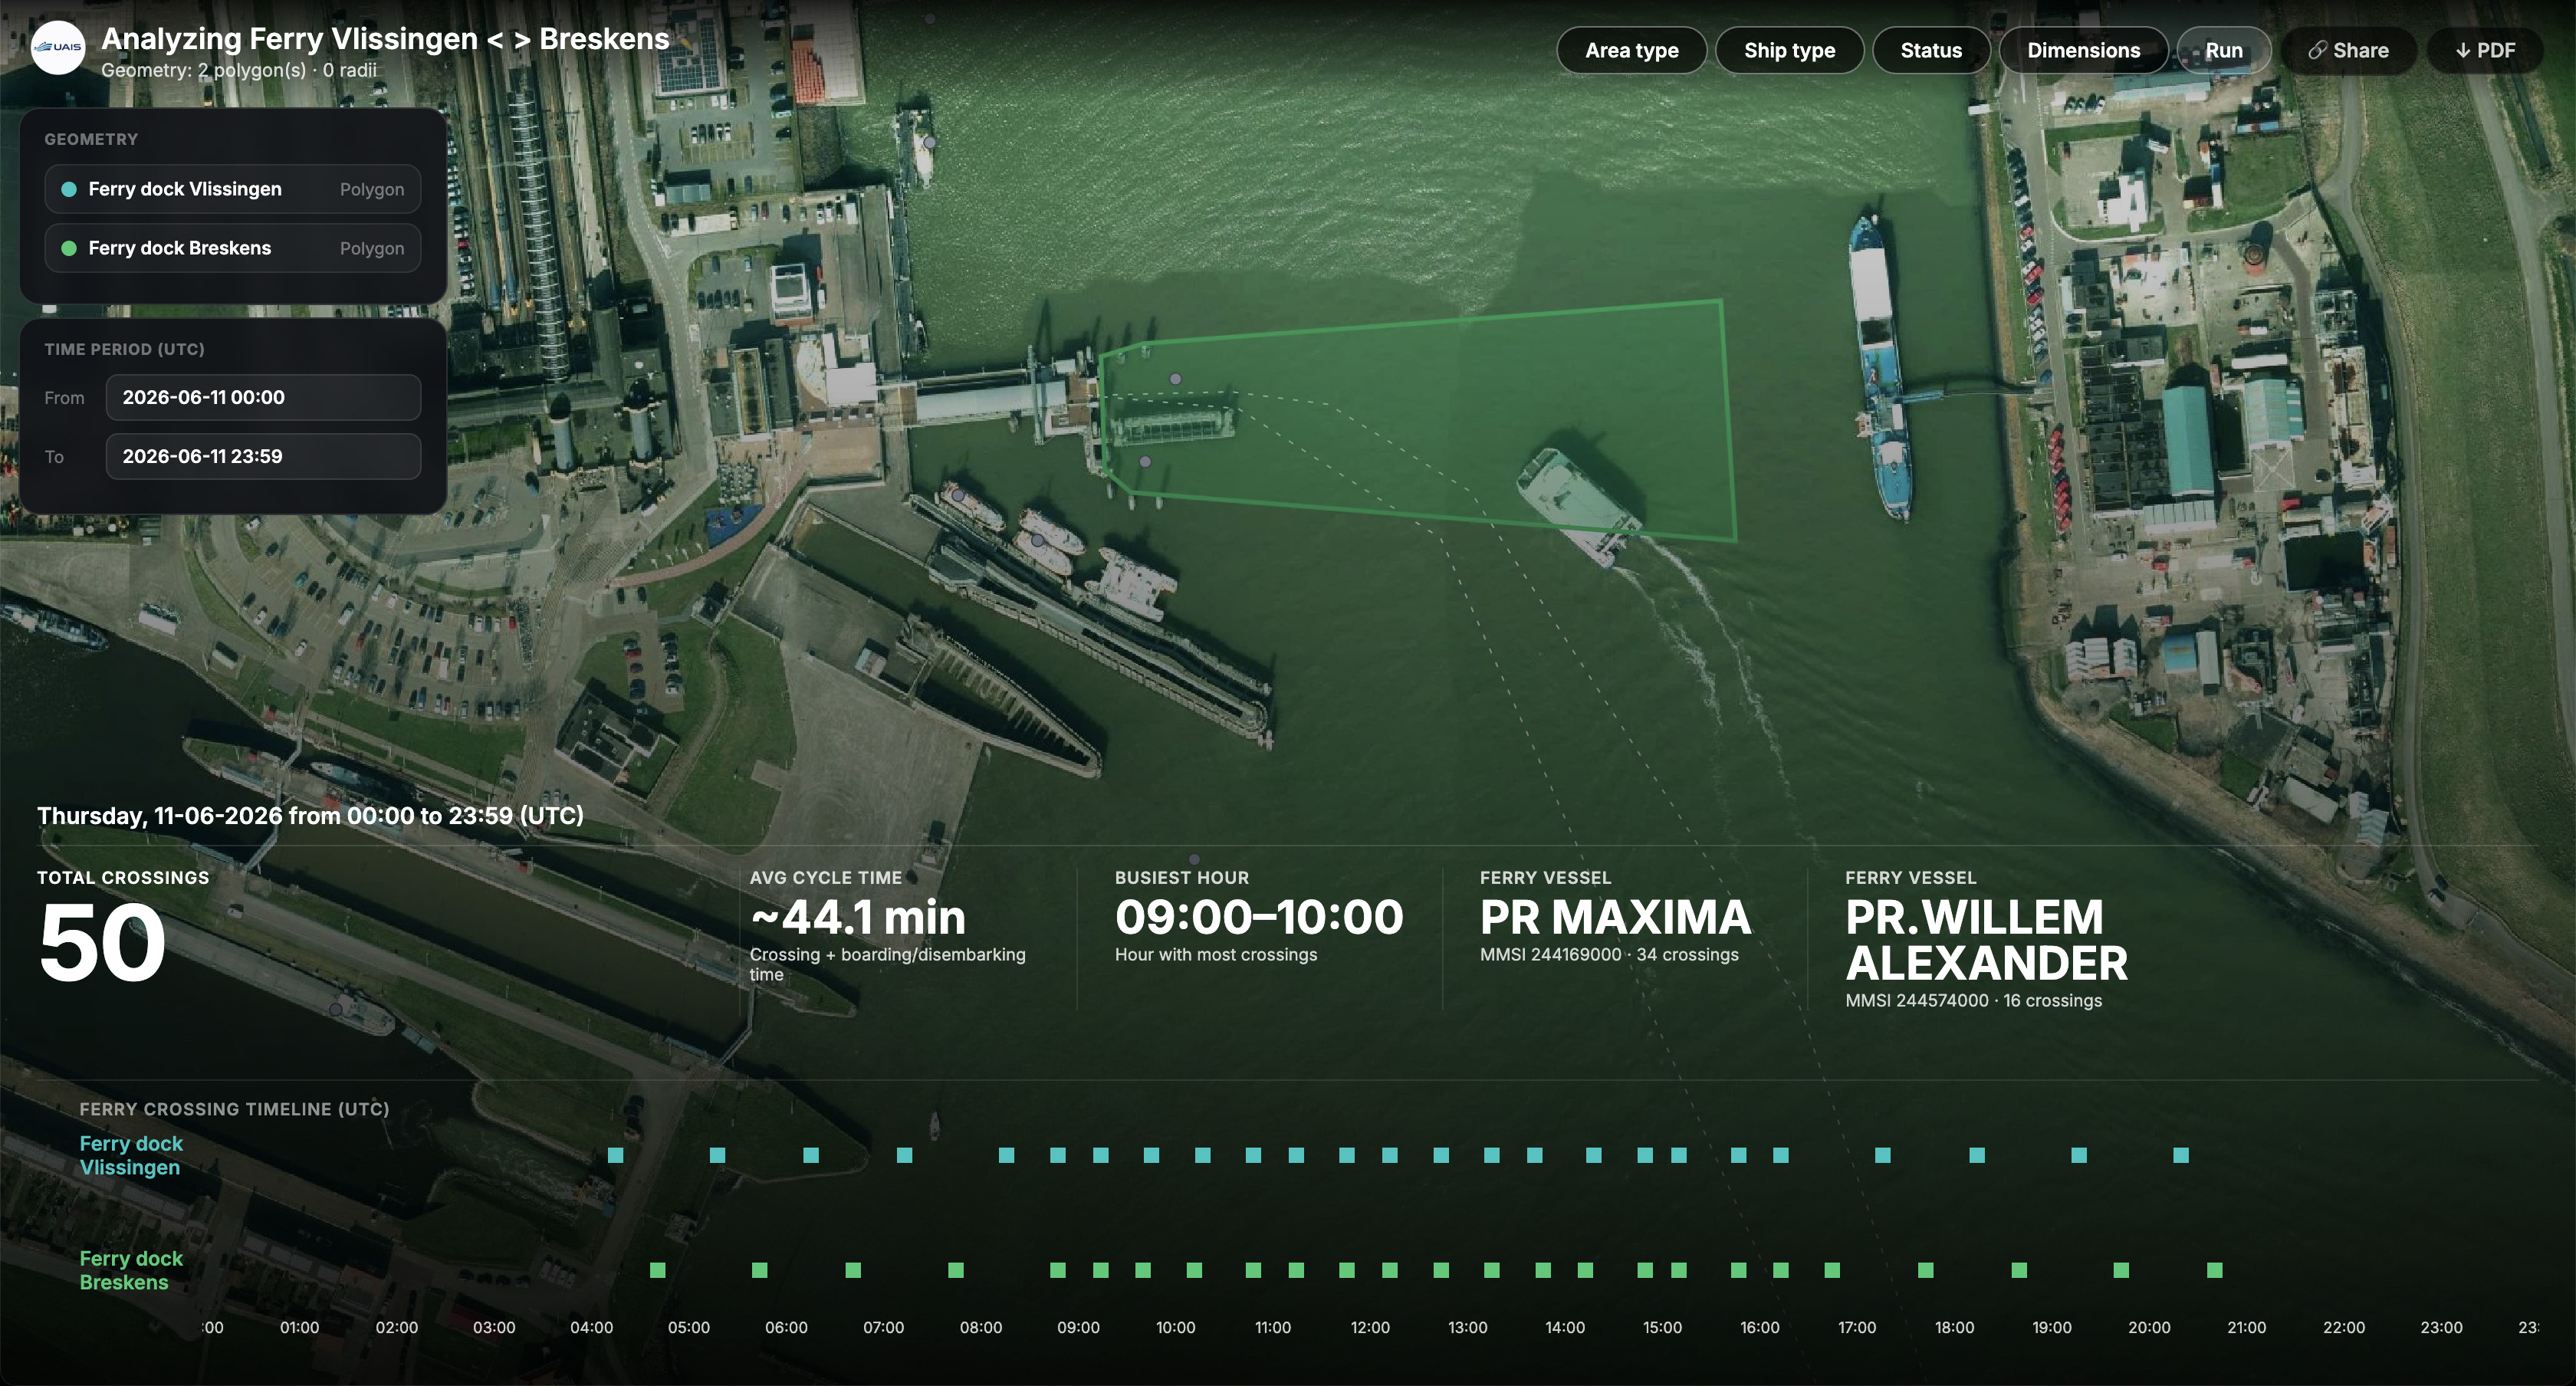
Place the radius or polygon closely around the actual landing spot on each bank. A geometry that is too wide may pick up vessels on a nearby berth or passing traffic.
Run the same analysis on a weekday and a weekend day to understand the difference in service frequency and passenger demand.
The average cycle time gives you the actual duration of a crossing — compare this against the published timetable to spot delays or early departures.
Share a direct link to this analysis with colleagues, or save the results as a PDF report for offline use.
Open UAIS, start History mode and place two geometries on a ferry route near you.